REDCap Reports With Longitudinal Data
Events and arms in a REDCap project are powerful features for organizing and accurately collecting and labeling data. At the same time, adding events complicates the structure of your data, and once the data are collected, it’s important to understand how to report and export those data in ways that are useful for the research team and for data analysis.
This post will illustrate how to use reports and calculated fields to “flatten” data across events and arms. It will cover the basics of setting up events and arms in a project, and then illustrate the problem with the resulting default data report of all data. Finally, it will step through adding calculated fields in specific instruments to copy data across events.
Contents:
- Setting up events and arms
- The default reporting behavior for multi-event data
- Add calculated fields to instruments to copy data across events
- Update calculated fields using the Data Quality tools
- View the updated report with the calculated fields
Setting up events and arms
Arms and events are part of projects that have “longitudinal data collection with defined events” enabled in the Project Setup.
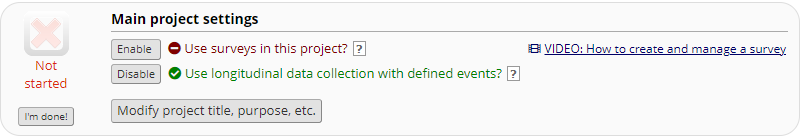
Once enabled, arms and events are also defined in Project Setup:
The example project for the post has multiple arms (for student and teacher data), with multiple events:
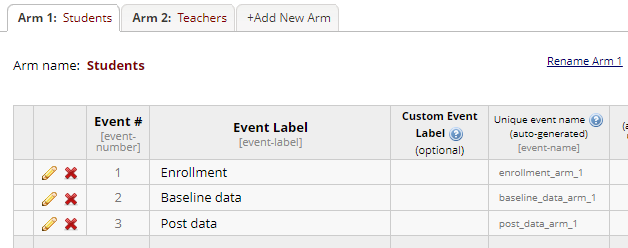
For this project, the first instrument of the project contains only the Record ID and a variable for indicating the arm of the study to which the Record ID belongs. This instrument, called “Records”, is repeated in the Enrollment event of both arms.
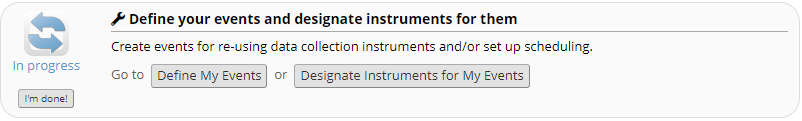
Once the arms and events are added, the next step is to “Designate instruments for my events” as shown here:
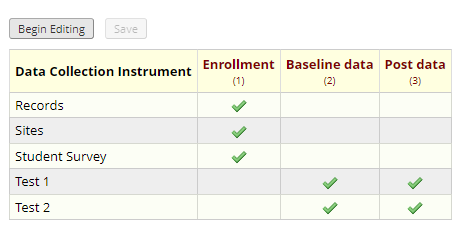
In this example, the events allow two instruments, Test 1 and Test 2, to be assigned to a study participant twice each at specific data collection events. This example illustrates the "enrollment" event where demographic data are collected, followed by a “baseline” data collection and a “post” data collection, theoretically to be collected after some period of time or after some intervention was administered.
The default reporting behavior for multi-event data
As records are added and data collected, the Record Status Dashboard reflects the status of records collected at each event:
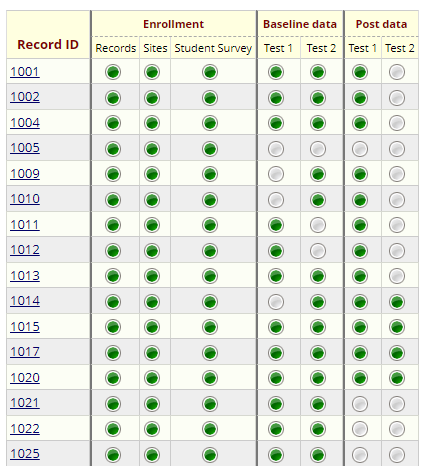
While this view of the data facilitates data entry, reporting out those data may not be so straightforward.
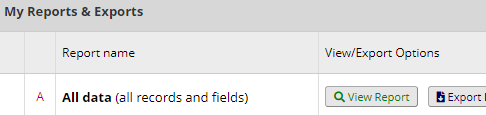
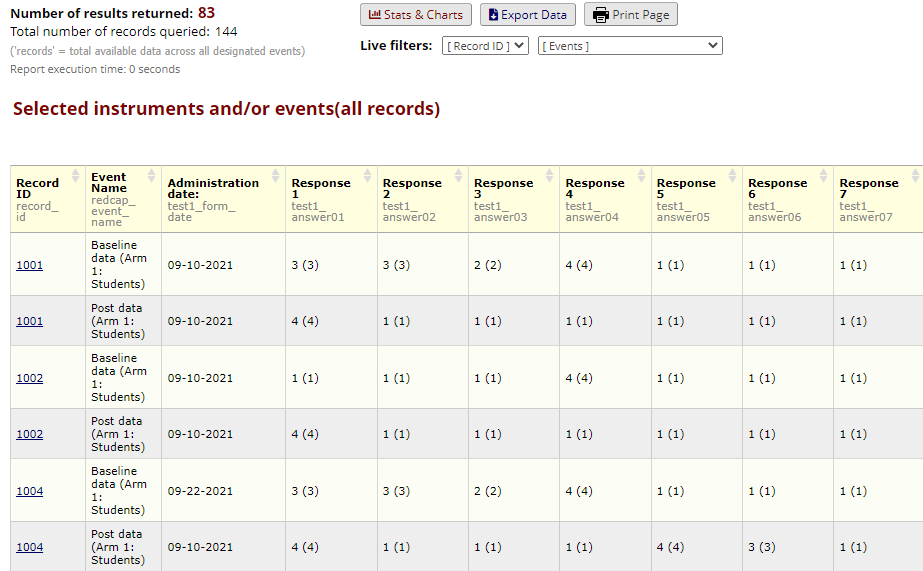
For example, to create the “all data” report, choose the “All data” option from the Data Exports, Reports and Stats link (under Applications) and select the “View Report” button.
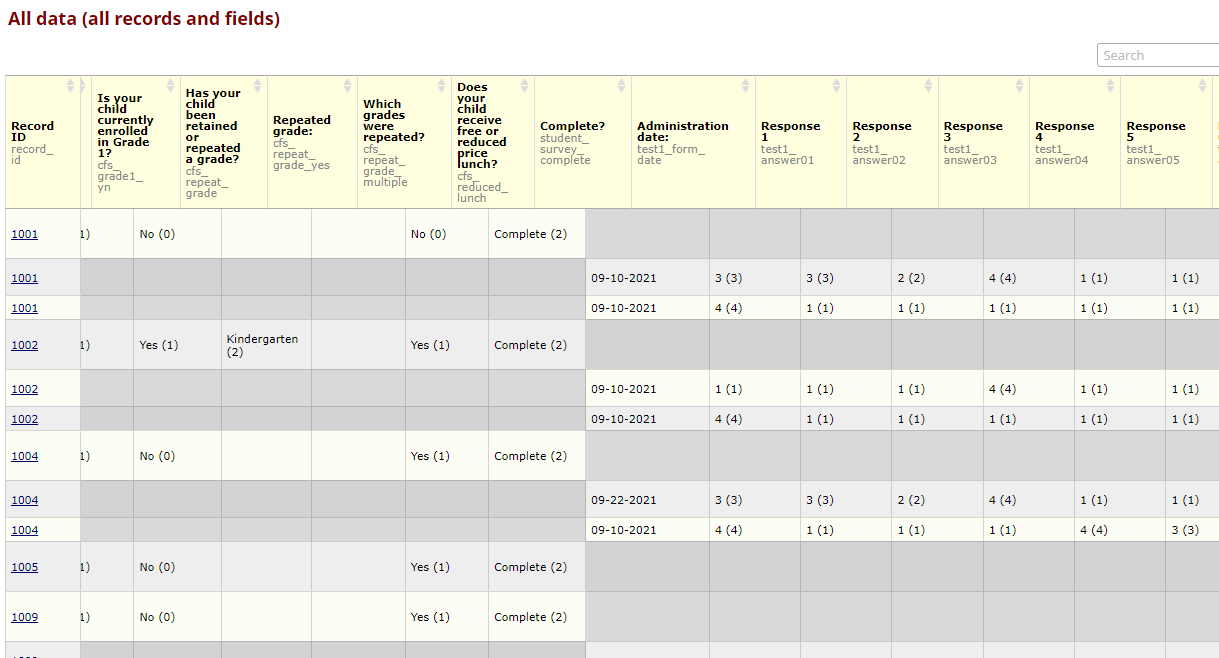
The report of these data looks “jagged” and disjointed, with the data from the different arms and events not lining up by default. While this is behaving as the REDCap program is intended, it can be disconcerting the first time you see it.
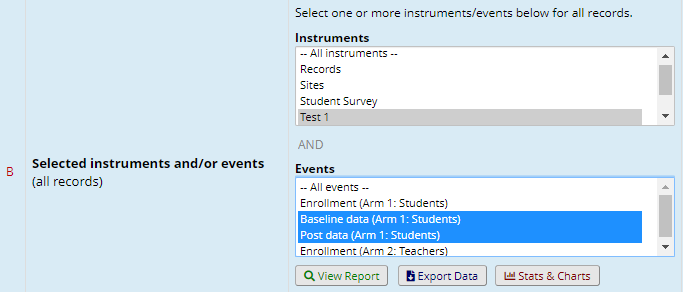
Alternatively, you can create a report that only displays specific instruments. Again from the Data Exports, Reports and Stats link (under Applications), you could choose "Make custom selections" instead:

Then choose, for example, Test 1 in the “Baseline” and “Post” data:
However, viewing only instruments for a specific event excludes the demographic and identifying data from the Enrollment event. For example, the Enrollment event data for each student includes their gender, age at enrollment and their School ID. These data aren’t included.
Add calculated fields to instruments to copy data across events
To include data from the Enrollment event, use calculated fields to copy missing values across events. In this example, we want to add the School ID variable from the Enrollment to the Test 1 instrument.
Essentially, this is the same idea as “piping”, but is stored at the record level. In addition to flattening the report data, it can be useful for event-level logic in survey queues, or in data display in REDCap such as in Project Dashboards.
Add a new field to the instrument using the Calculated Field type. Label it and create a variable name. To calculate the field value, use the Calculation Equation setting to reference the School ID variable in the Enrollment arm.
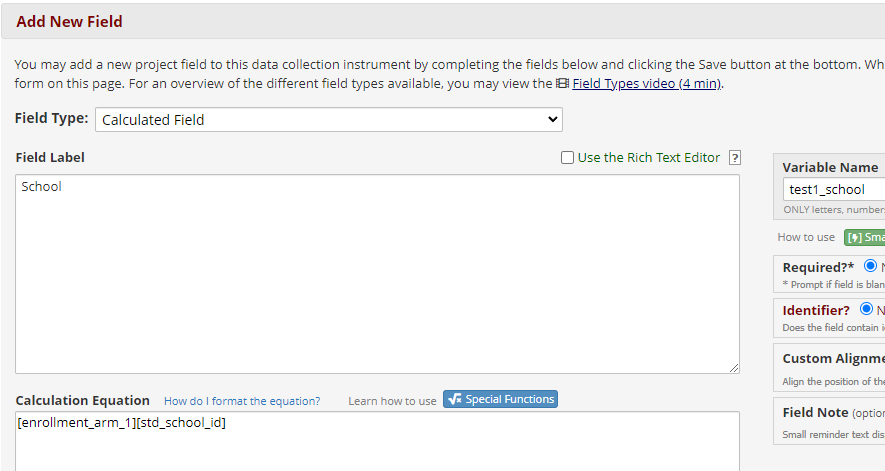
Use the Logic Editor to help you build the Calculation Equation value:
![Screenshot of the Logic Editor showing the referenced variable with the event name and variable name in square brackets. The syntax displayed is [enrollment_arm_1][std_school_id].](/sites/lsi/files/files/hallberg-blogs/blog02-pic12.png)
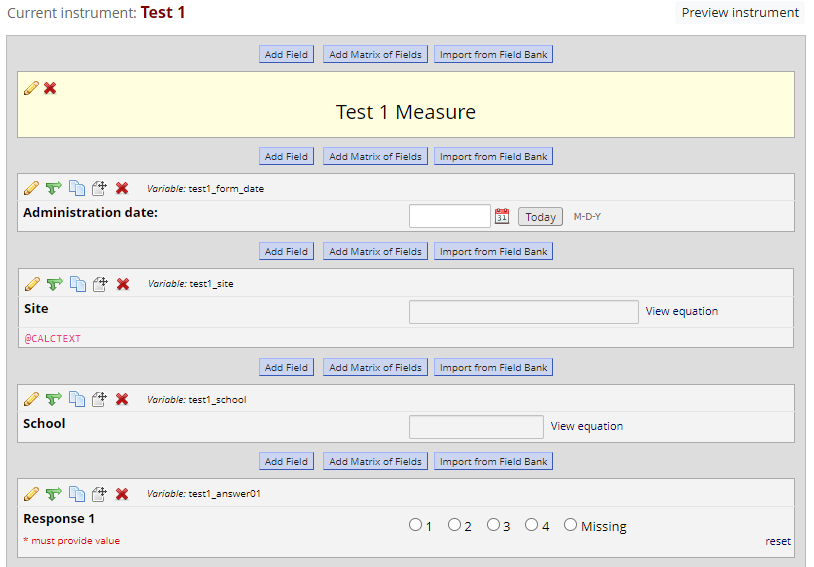
Note that this example assumes that the School ID is a numeric value. If the variable value you want to repeat across events is a text value, instead add a Text Box field type, and use the @CALCTEXT Action Tag to display the value. In this example, there is a Site variable that is stored as text, either “A” or “B”. To include that, we add a Text Box, and in the Action Tags / Field Notation field we can add the “record_site” variable, also from the Enrollment event.
![Screenshot of the Logic Editor showing the syntax for using the @CALCTEXT Action Tag to reference a text variable value. The syntax is @CALCTEXT([enrollment_arm_1][record_site]).](/sites/lsi/files/files/hallberg-blogs/blog02-pic13.png)
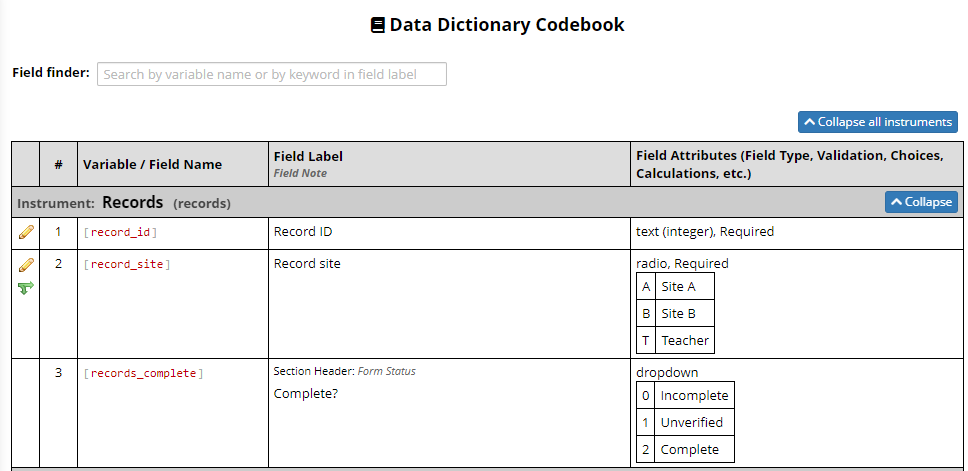
Don’t forget that you can open the Codebook directly in the Logic editor if you need to look up a variable name.
In the Designer, the form now looks like this:
Update calculated fields using the Data Quality tools
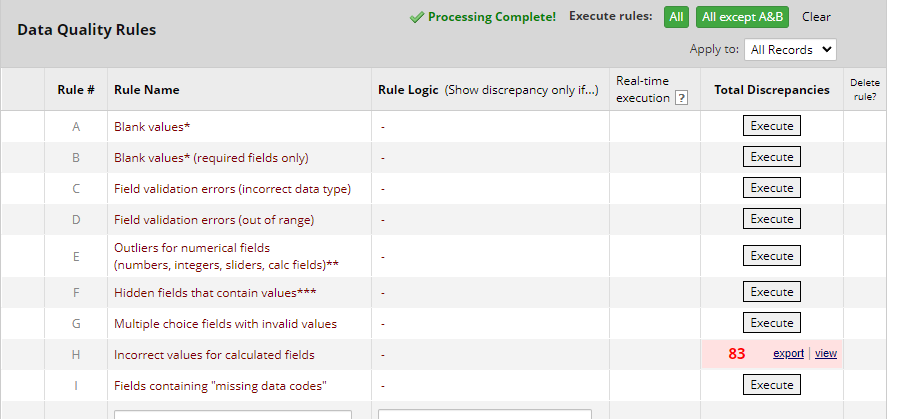
After adding calculated fields to an instrument that already has data, use the Data Quality tool (in the Applications menu) to force these values to be calculated or recalculated in the existing records. Choose the Execute option for the "Incorrect values for calculated fields" rule to see a report of affected records. If there are any incorrectly calculated fields - as there should be after we added these new variables - they will be listed in the Total Discrepancies column.
Choose the “view” option to see the list of values:
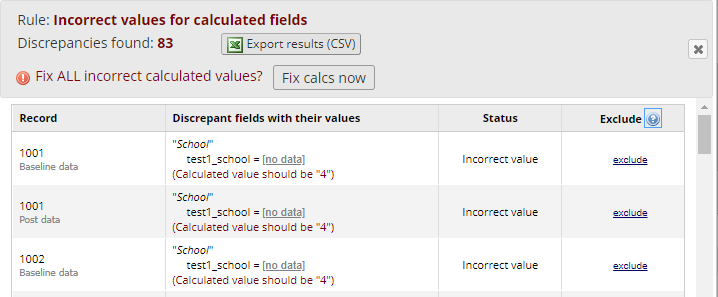
Use the “Fix calcs now” button to apply the changes and populate the missing values.
View the updated report with the calculated fields
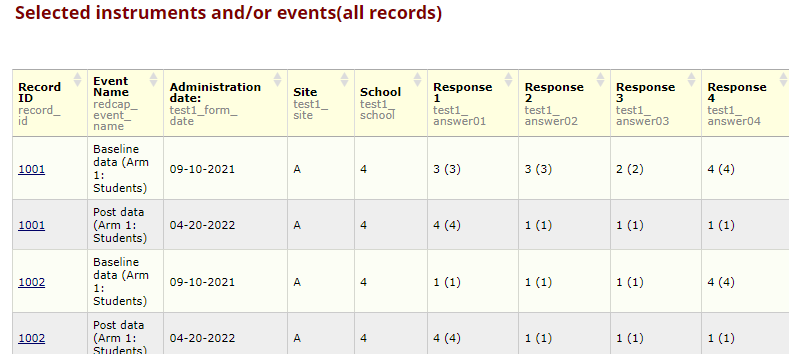
Now you can re-run the report to view the values copied over from the Enrollment event:
Conclusion
These examples are intended to illustrate one way to display record data across events for a longitudinal project in REDCap. There are many ways of doing this, especially outside the REDCap project. However, if the data need to be aggregated directly in REDCap, this concept provides a way achieve the same effect as merging separate one-to-many files into a single report.
Lisa Hallberg is a research engineer with the Life Span Institute's Research Design and Analysis team.