KU Researchers highlight how $80.6 billion in federal spending supports individuals with intellectual and developmental disabilities nationwide
Note for editors and media members: Media members may contact Jen Humphrey, associate director for external affairs at the KU Life Span Institute. Individual state profiles of federal spending to support individuals with intellectual and developmental disabilities are available through the State of the States website and may assist in localizing figures. Project director Shea Tanis, an expert on intellectual and developmental disability funding and supports, is available to speak with journalists.
Twenty-five years ago, the U.S. Supreme Court’s landmark decision in Olmstead v. L.C. found the unjustified segregation of people with disabilities violated the Americans with Disabilities Act. The decision ultimately influenced the amount and distribution of federal funds to support individuals with intellectual and developmental disabilities, which now totals $80.6 billion.
In recognition of the anniversary of the 1999 decision, which was celebrated June 20 by the U.S. Department of Health and Human Services, University of Kansas researchers shared information about how federal funds are distributed to each state to help individuals, families and caretakers.
The figures are a part of the work conducted by the State of the States in Intellectual and Developmental Disabilities Ongoing Longitudinal Data Project of National Significance. The project, now based at the KU Life Span Institute, has tracked federal spending in this area for more than 40 years and provides governments and the public with state-by-state data and comparisons.
Project director Shea Tanis, associate research professor at the KU Center on Developmental Disabilities, and research team members explored what the public receives with its investment and broke down the $80.6 billion spent in fiscal year 2021, the latest year for complete figures. Tanis, who is available to help journalists and other media members further understand the data, is nationally recognized for her expertise in applied technology solutions, cognitive accessibility, and advancing the rights of people with cognitive disabilities to access information and technology.

"The investments in intellectual and developmental disabilities services and supports across the nation are a measure of our conscience and commitment to the disability community. It demonstrates our expectations of full-participation, equal opportunity, economic self-sufficiency and independent living outlined in the Americans with Disabilities Act."
The following figures and accompanying links to individual graphics and maps break down spending and effects nationwide.
An overview of IDD funding: How much does the public invest?
An estimated 7.57 million people in the U.S. have intellectual and developmental disabilities (IDD). Many live in family homes and community-based settings.
The federal government invests in areas such as supported living, family supports, personal assistance, supported employment and other programs equal to about 0.1% of the $6.8 trillion federal budget for 2021 reported by the Congressional Budget Office, or about $80.6 billion, as described on the map below.
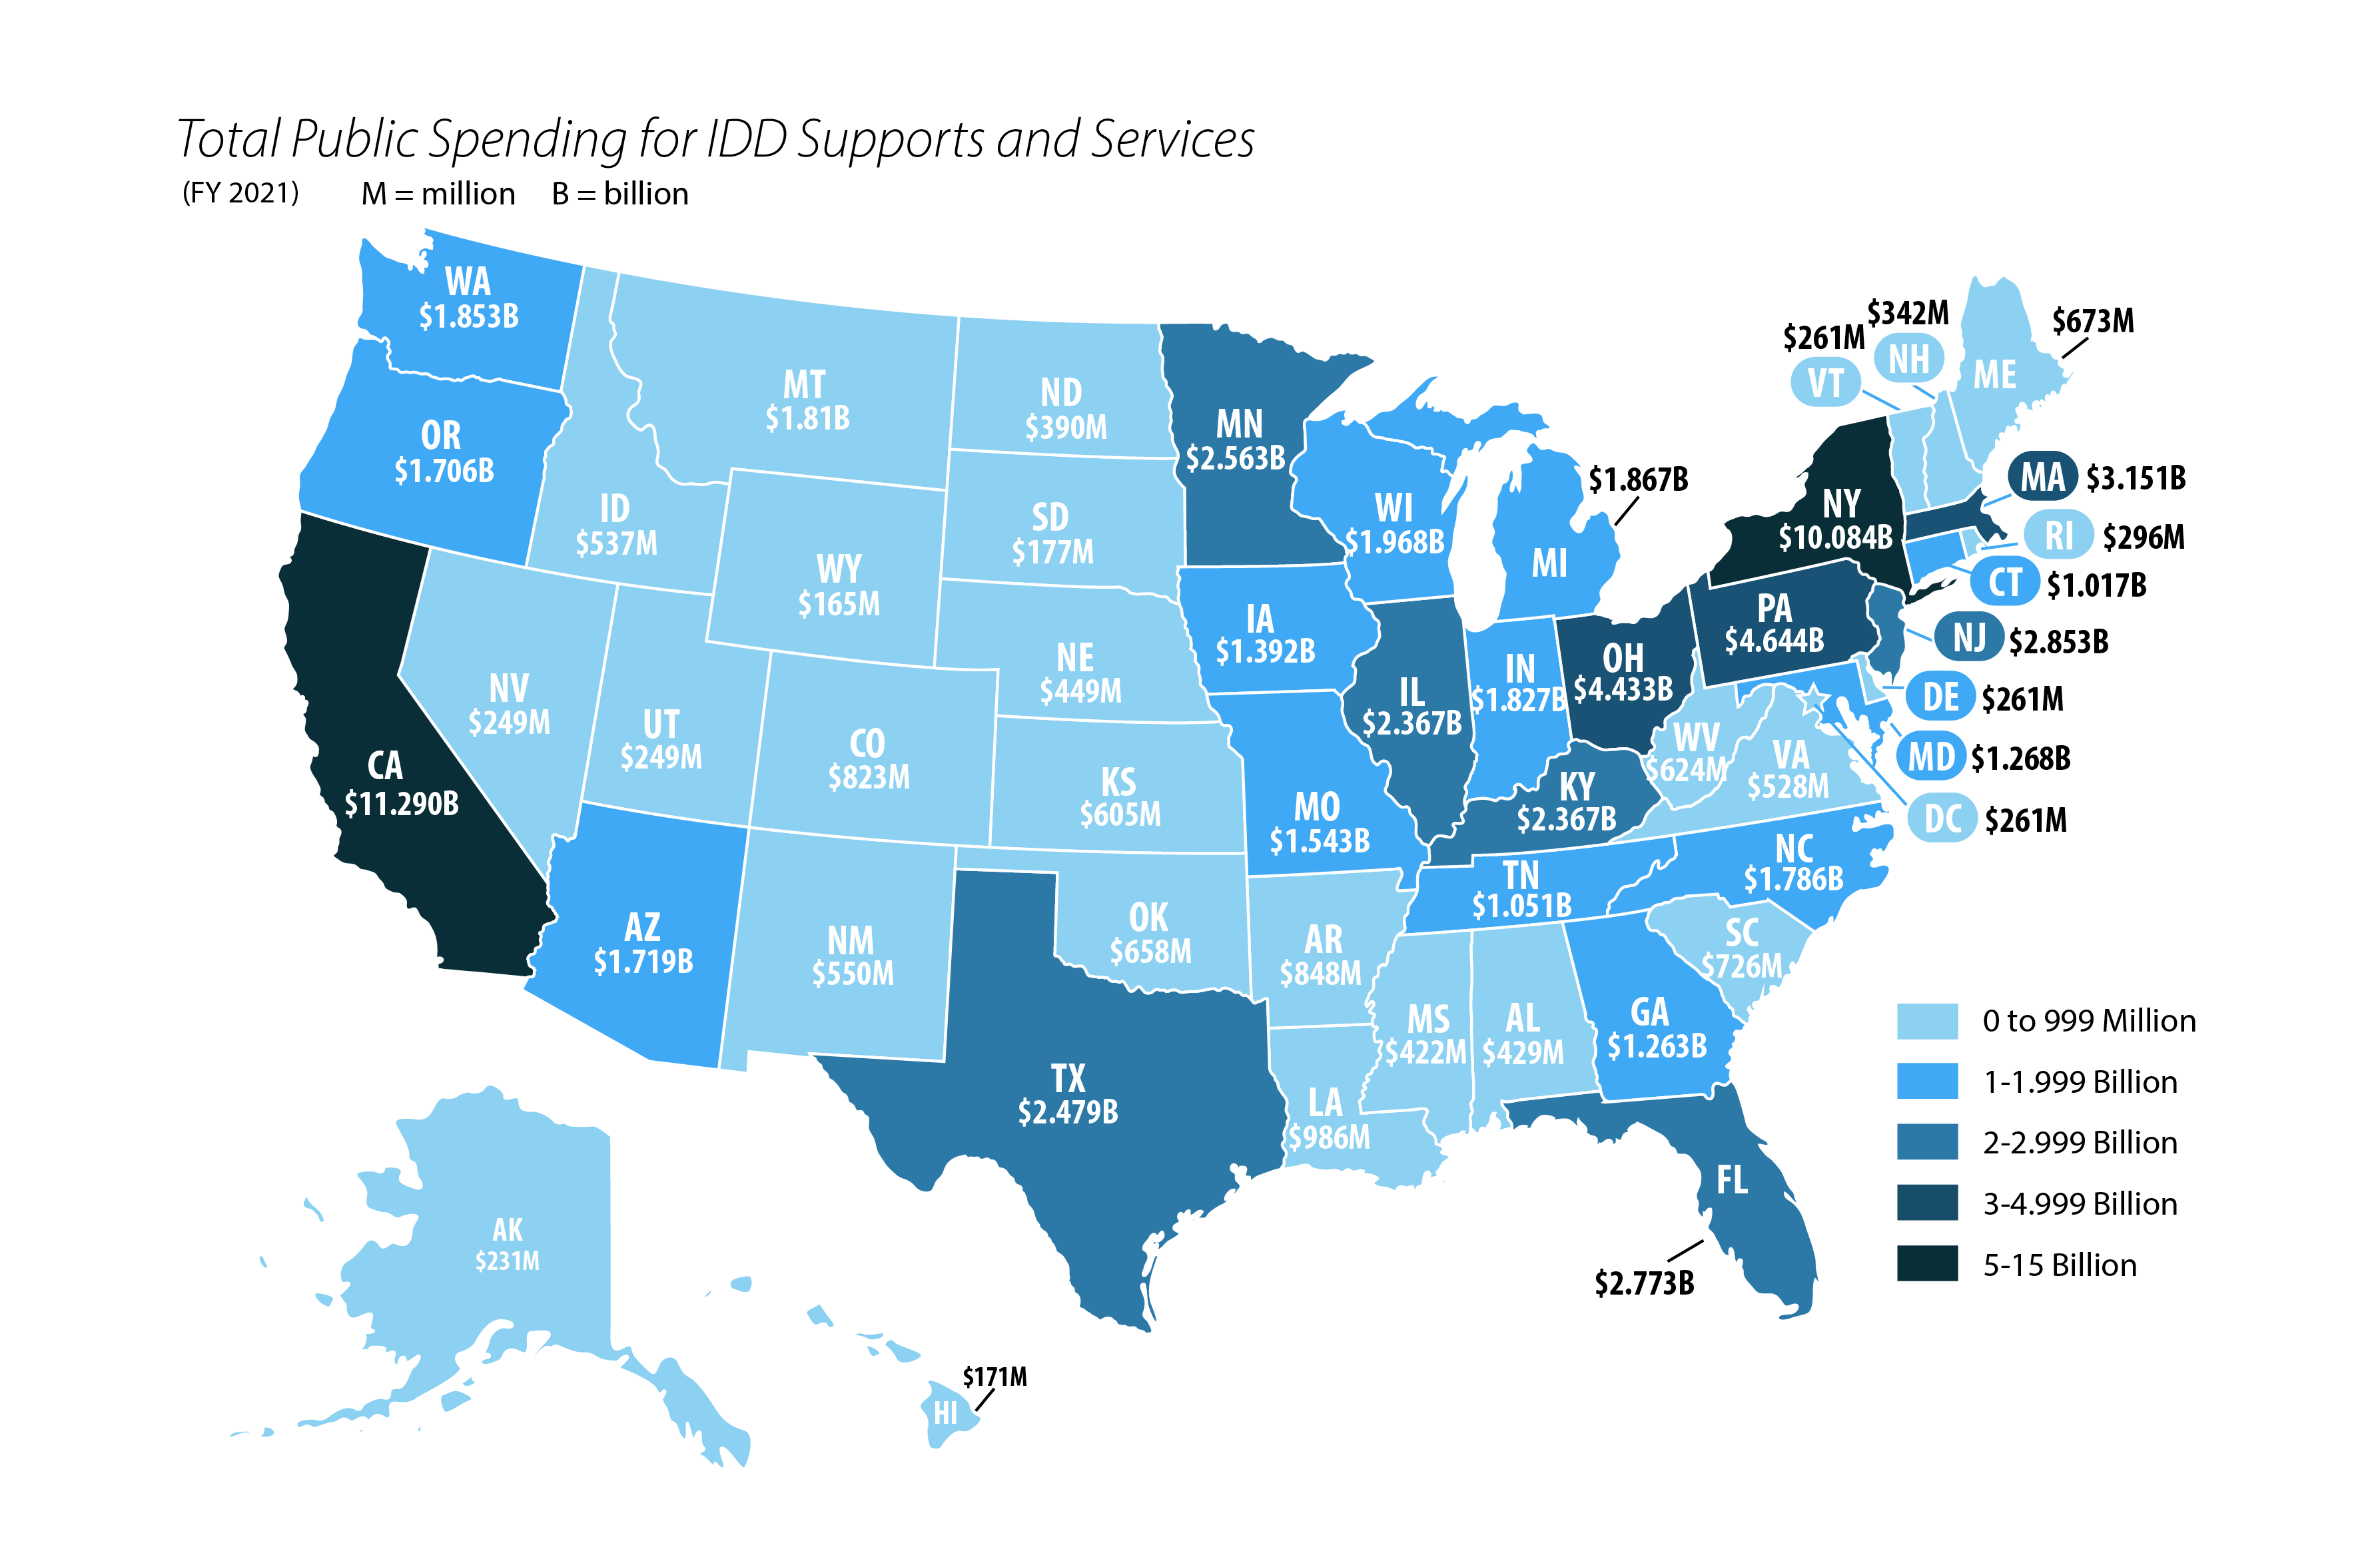
In FY2021, 87% of the total public funding for IDD services was distributed through Medicaid-related services.
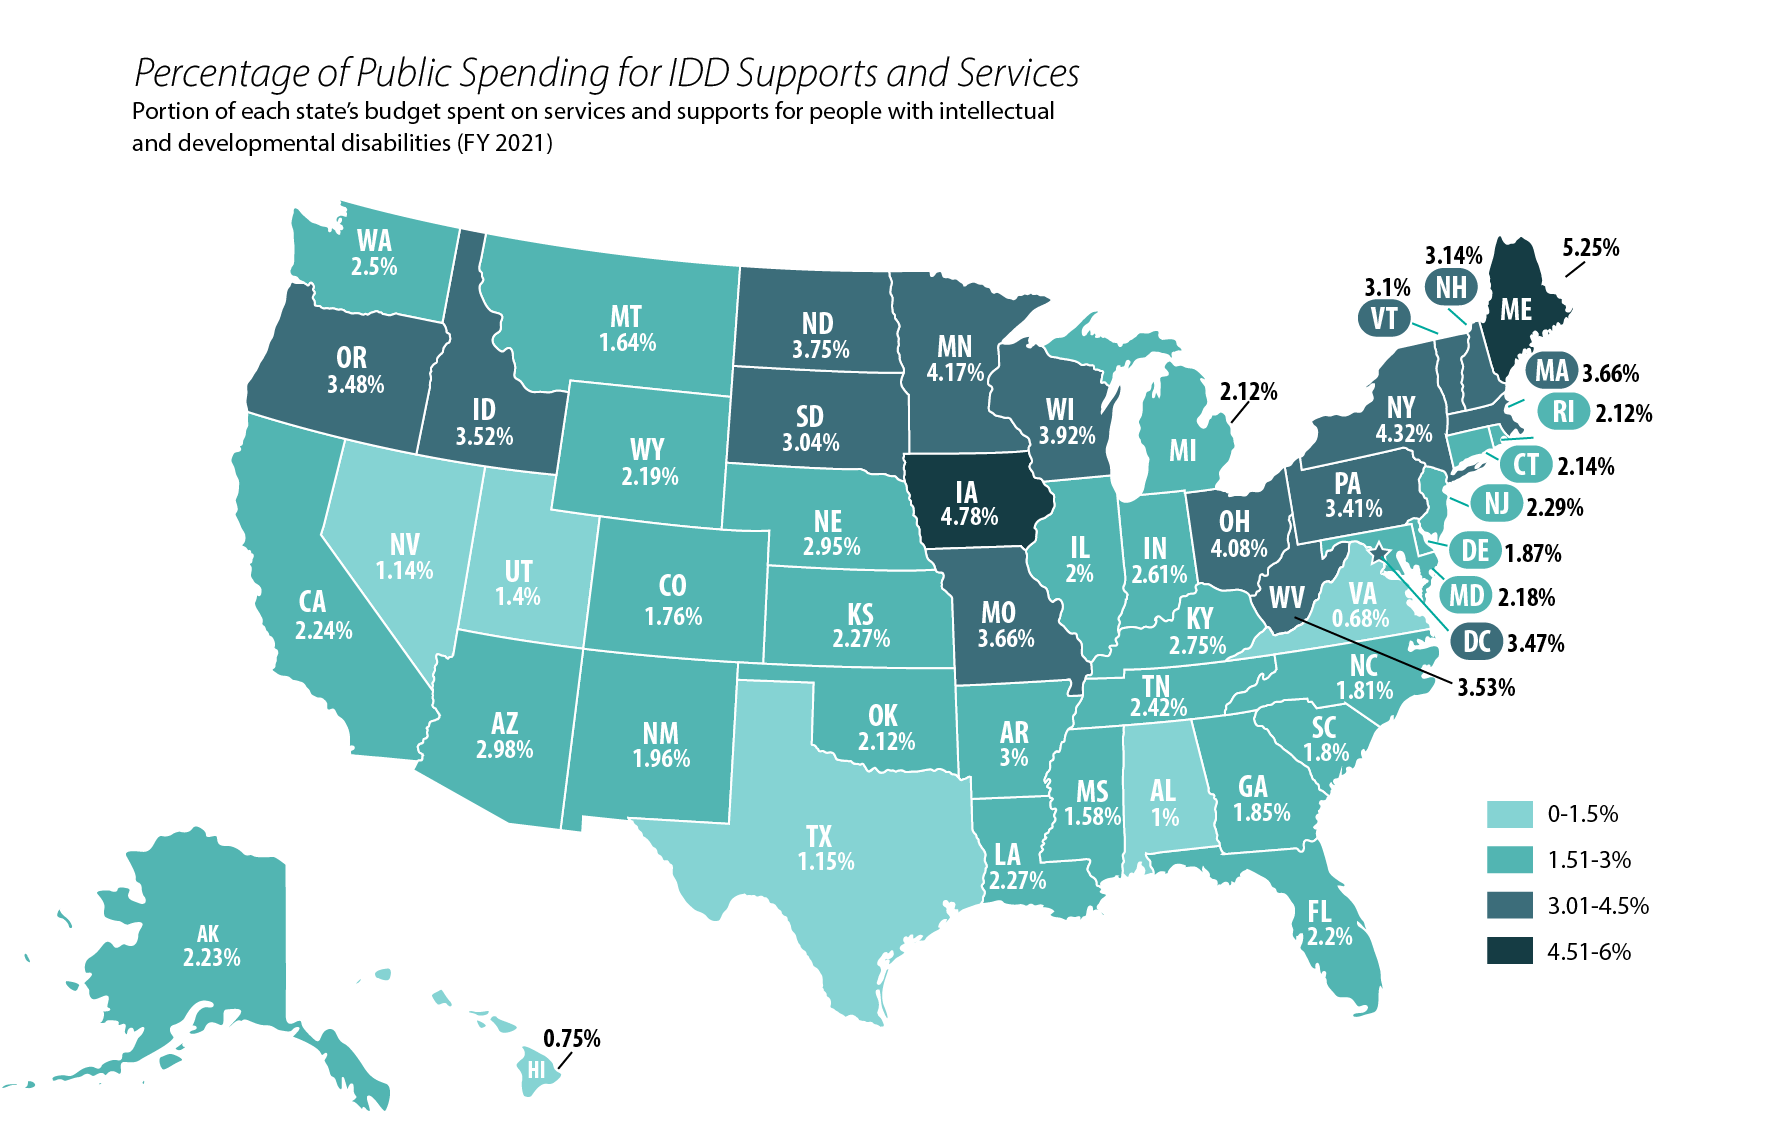
As a percentage of each state’s budget, supports for intellectual and developmental disability services make up between less than 1% and up to 6% of any state’s budget, or an average of 2.57%. This is illustrated in the map below.
How has funding for IDD supports and programs shifted?
Funding has pivoted away from congregate settings to home and community-based care. Before 1981, the United States largely provided comprehensive long-term care in institutionalized or congregate settings. In the decades since, states have greatly increased investment in home and community-based services, or HBCS.
In 1981, the U.S. government began to allow waivers for HBCS to allow recipients to receive care in community and residential settings as an alternative to institutions. By 1989, states began investing more money in community supports than institutional or segregated settings for people with IDD.
Then in 1999, the Supreme Court's decision on Olmstead v. L.C. found that unnecessary institutionalization to be a violation of civil rights.
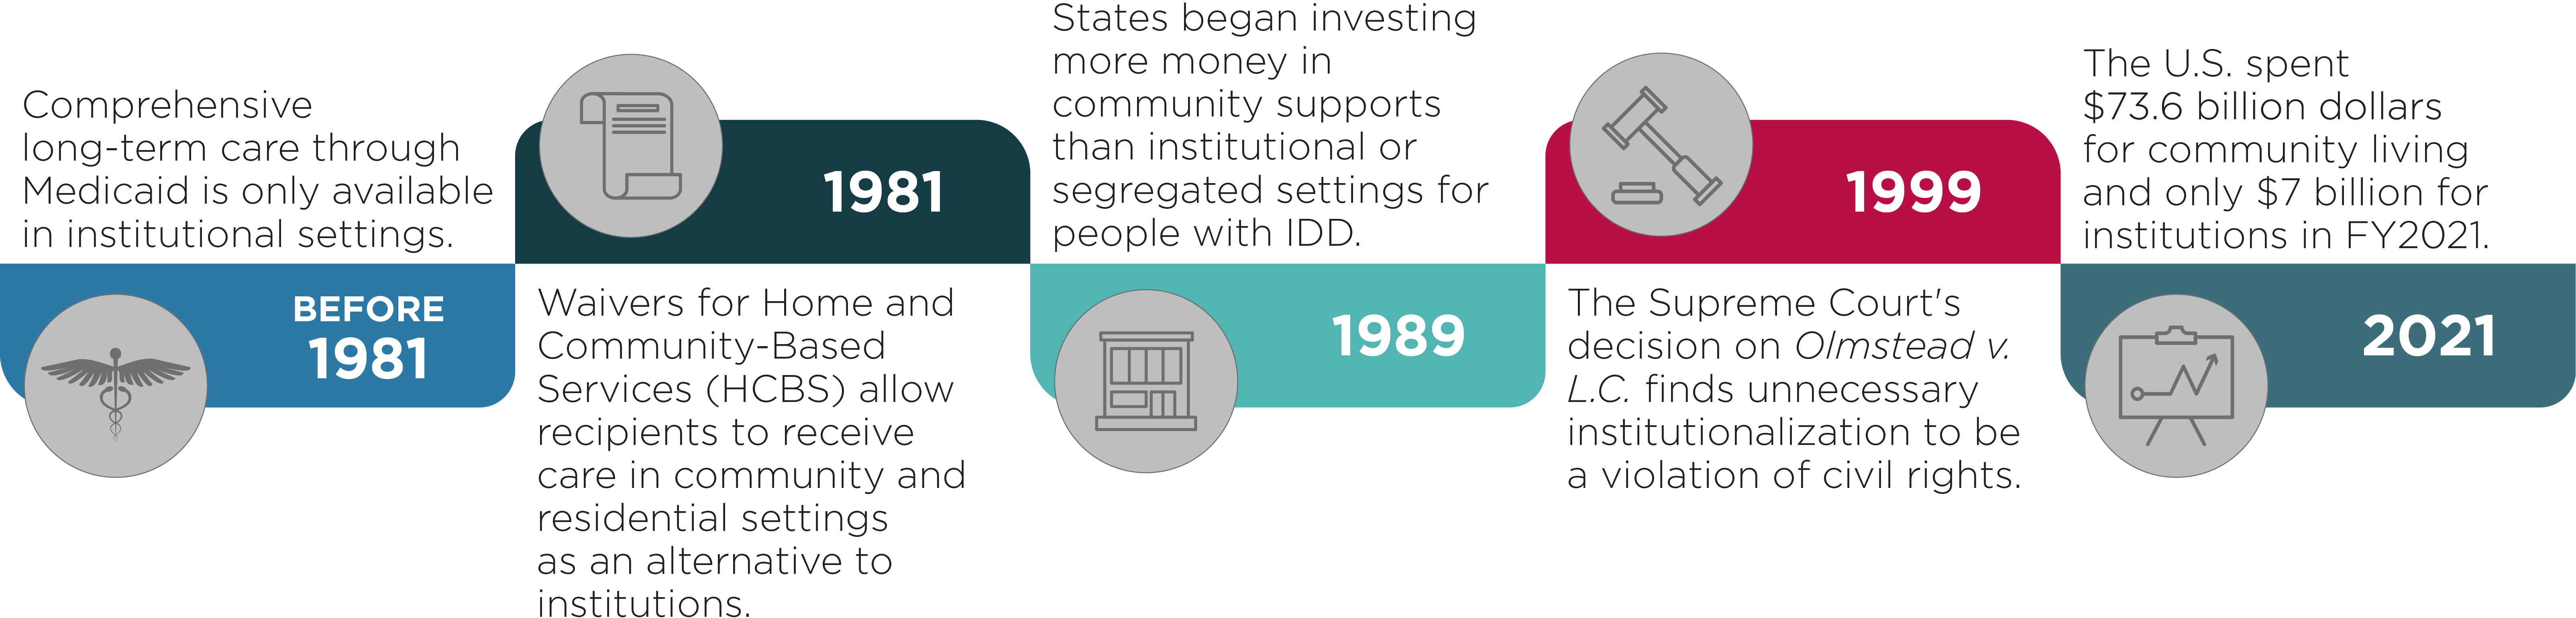
By FY2021, the U.S. spent $73.6 billion dollars for community living and only $7 billion for institutions, as shown in the graph below.

Selected IDD support and services
Details about the distribution and total support for supported living, family support, personal assistance and supported employment are described below.
FY 2021 Total Support for Selected Programs
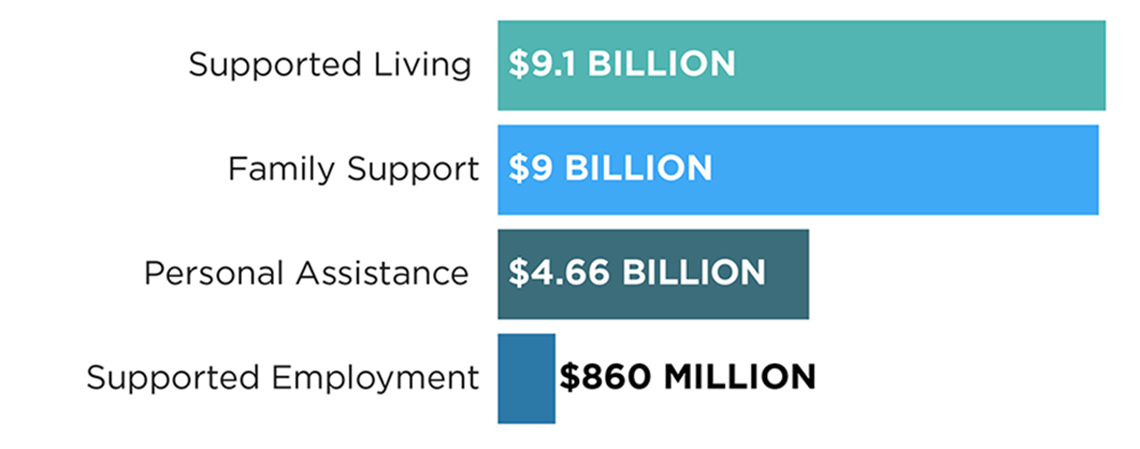
Supported Living Services: $9.1 billion in FY2021
Home and community based services (HCBS) provide opportunities for Medicaid beneficiaries to receive services in their own home or community rather than in institutions or other isolated settings.
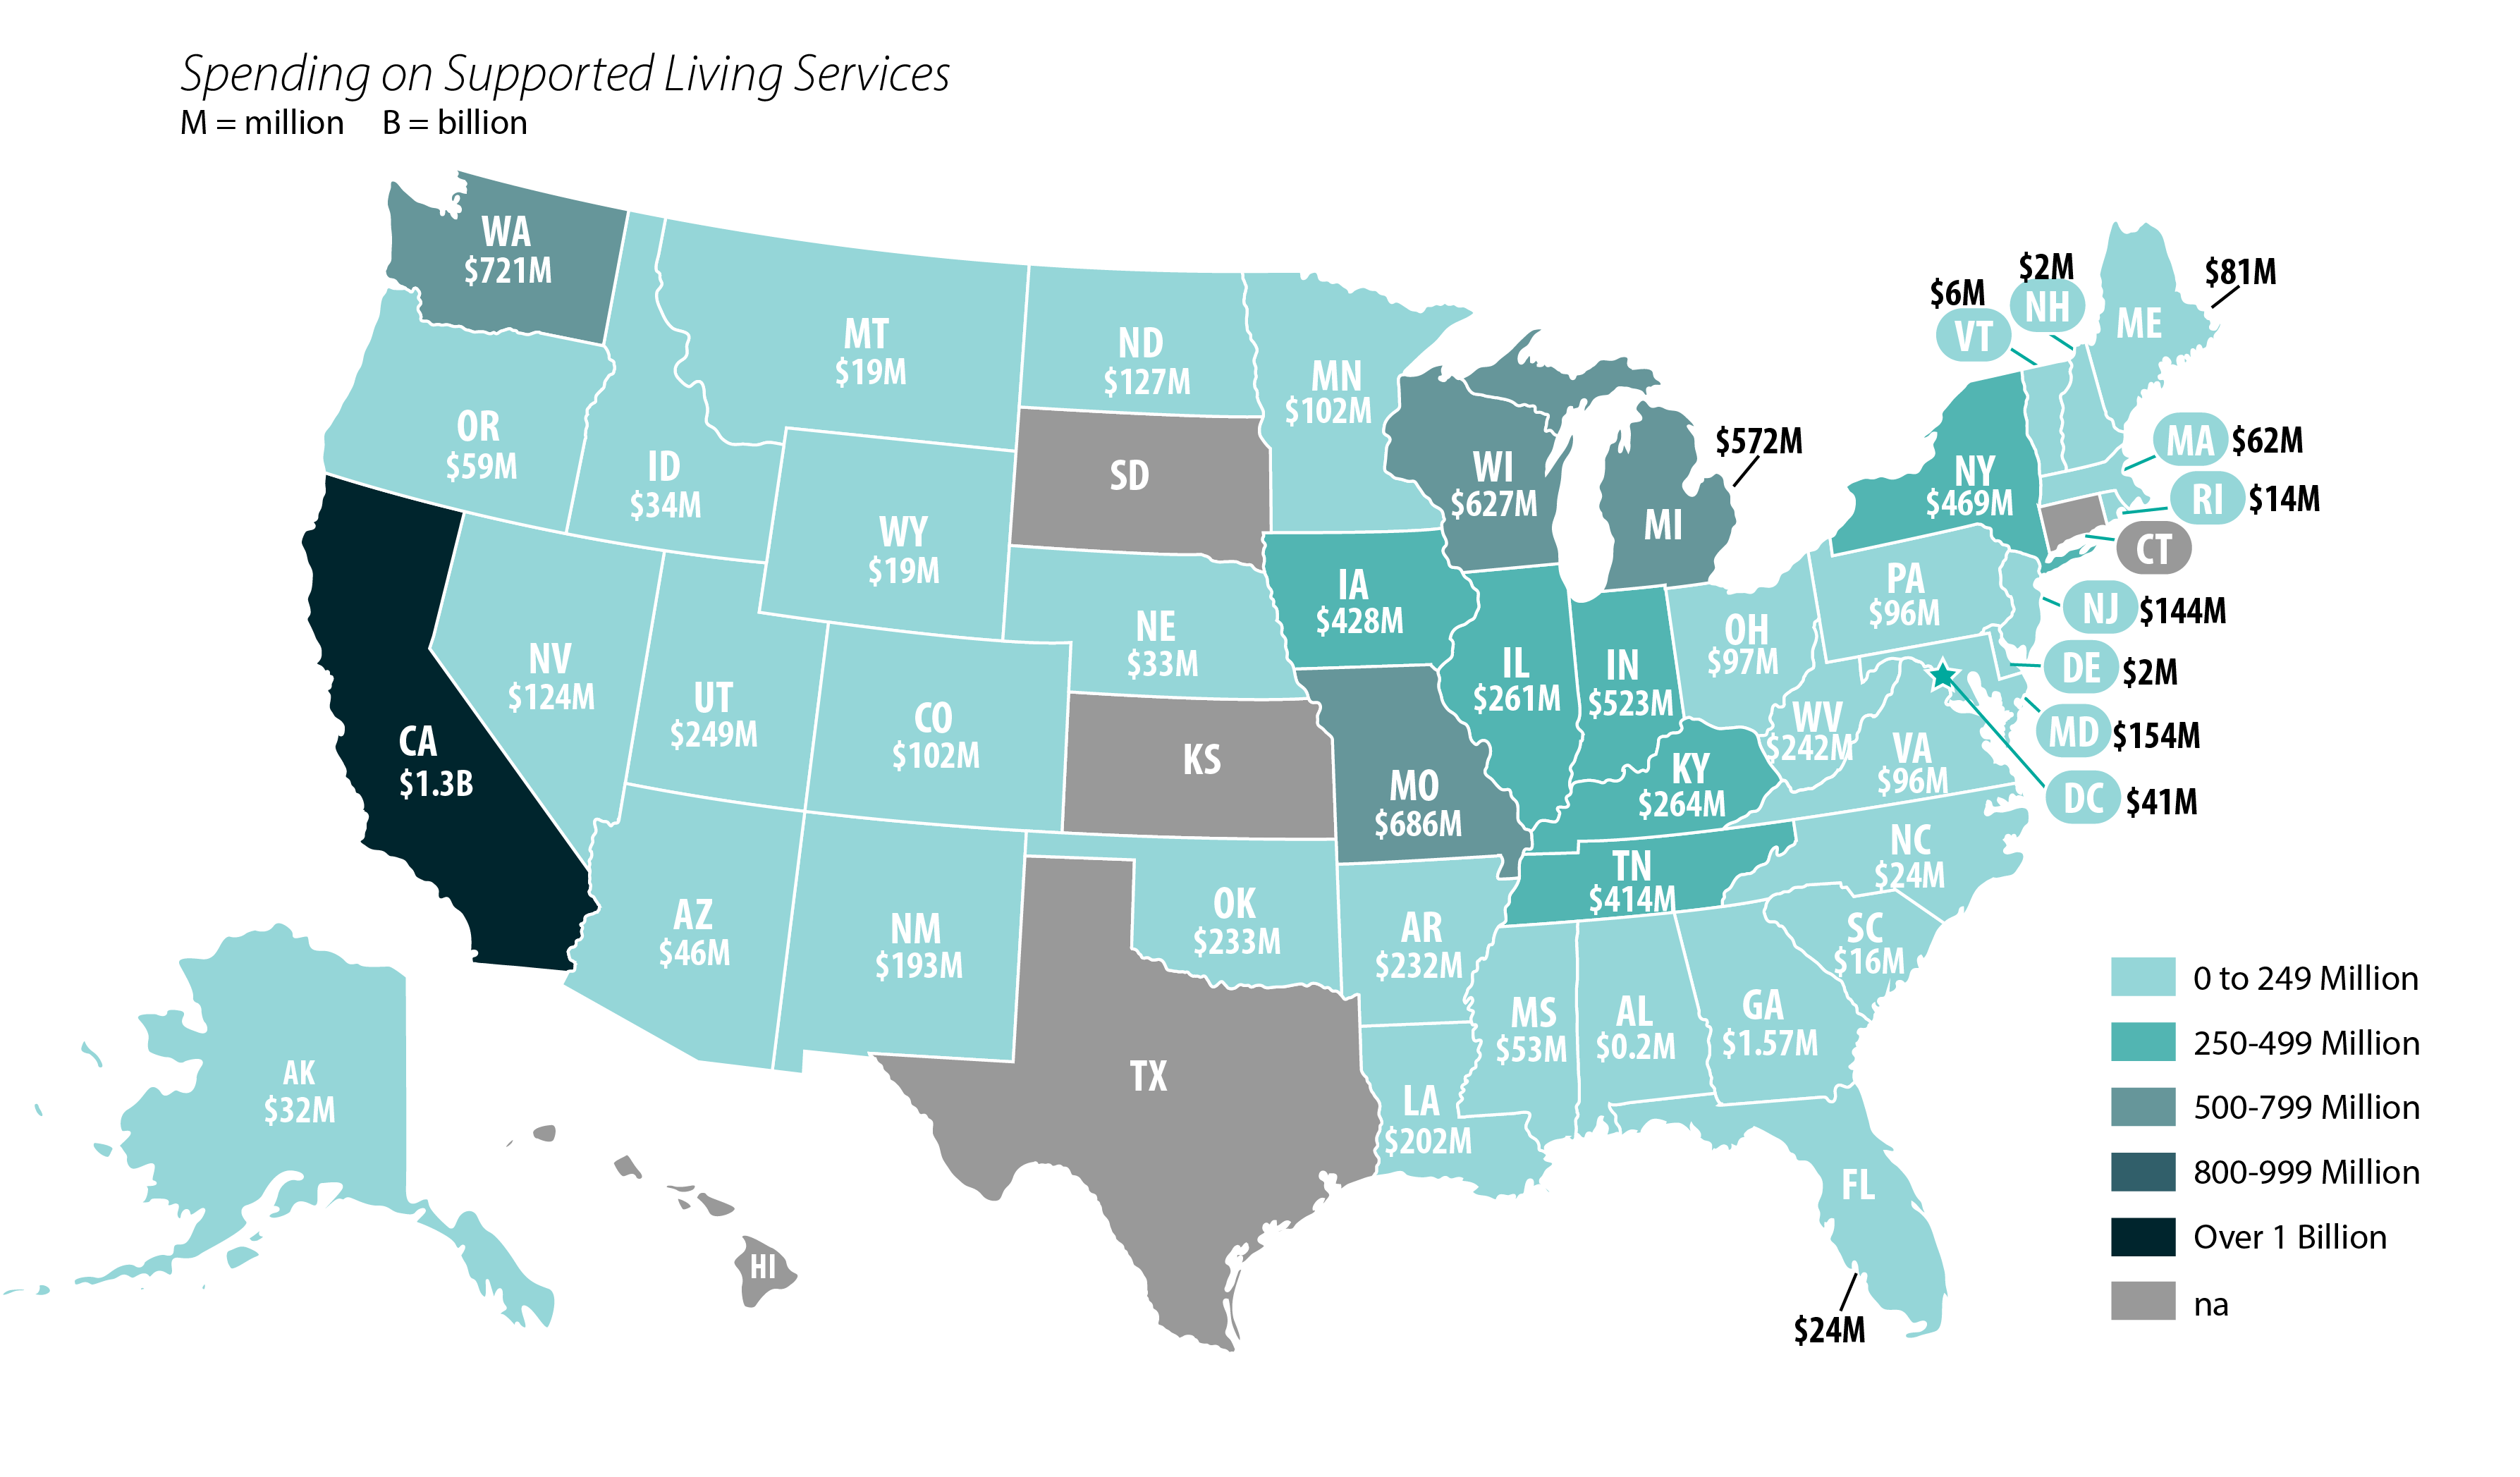
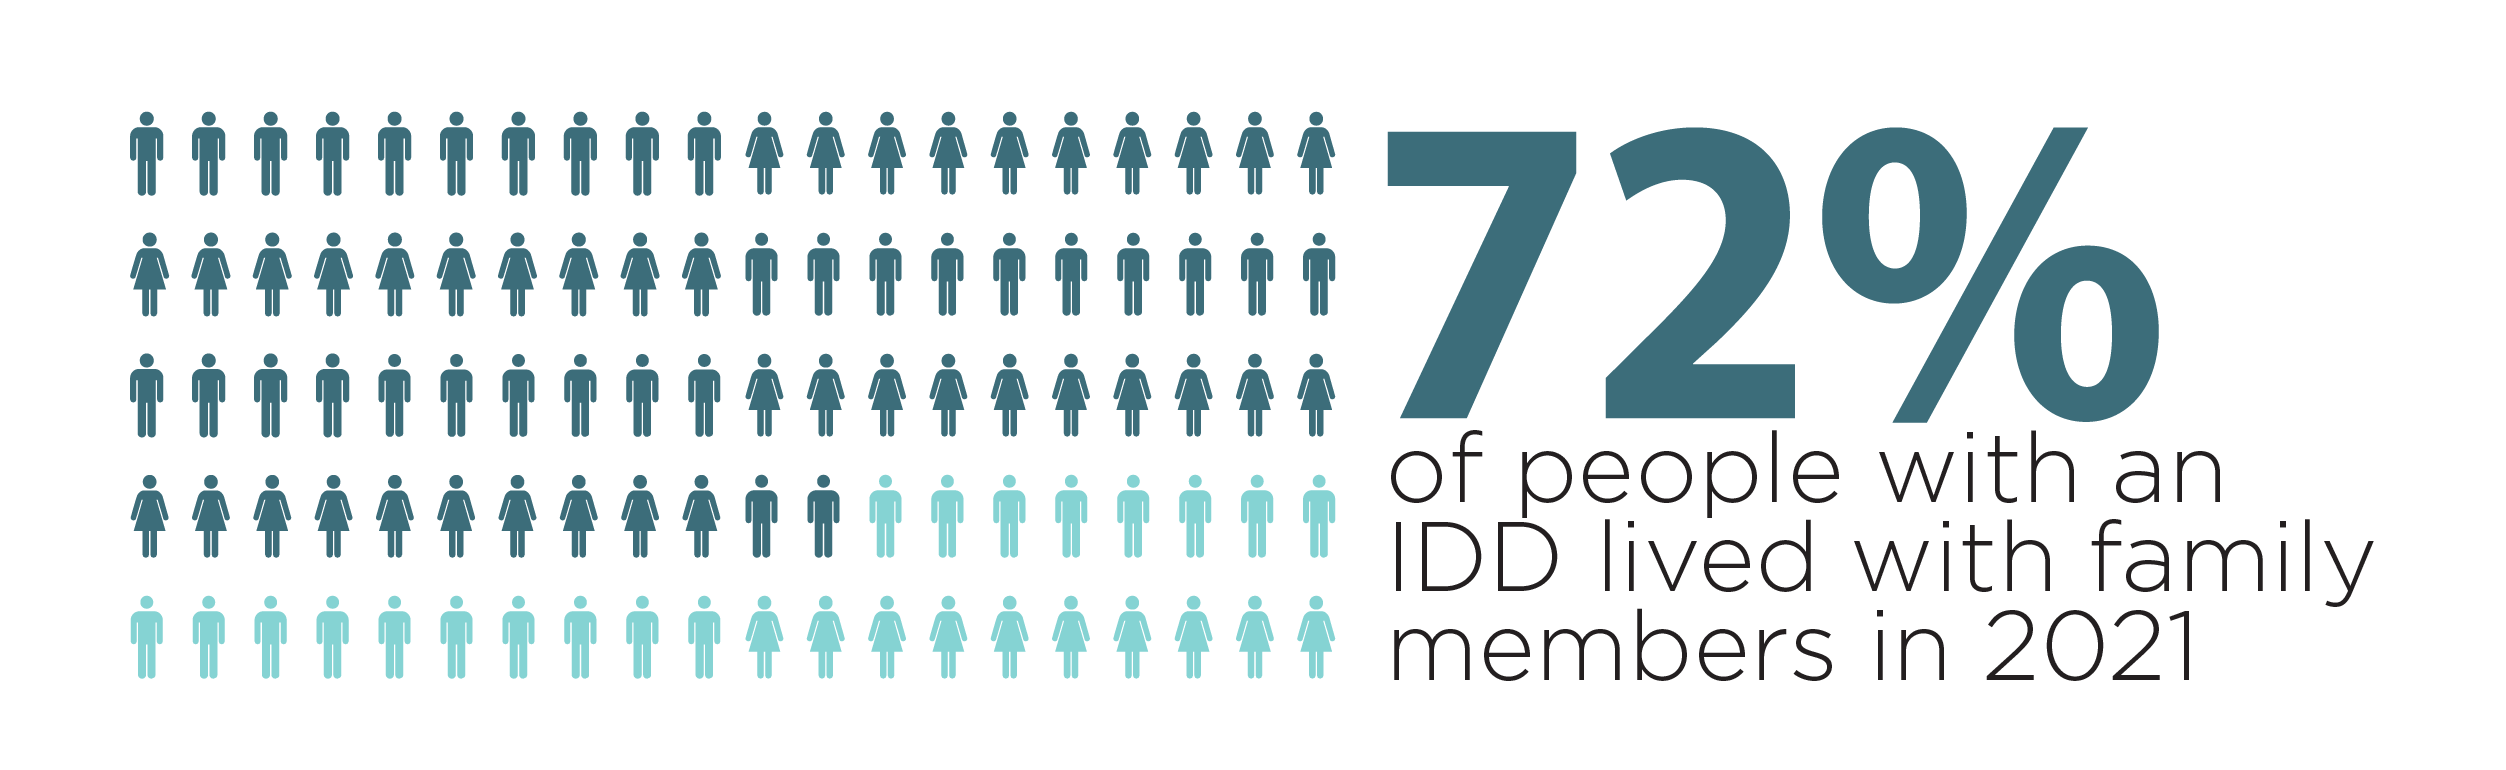
In 2021, more than 7 out of 10 (72%) of people with intellectual and developmental disabilities lived with family members. The HCBS program has grown nationally to support 894,000 people and families across the United States.
Family Supports: $9 billion
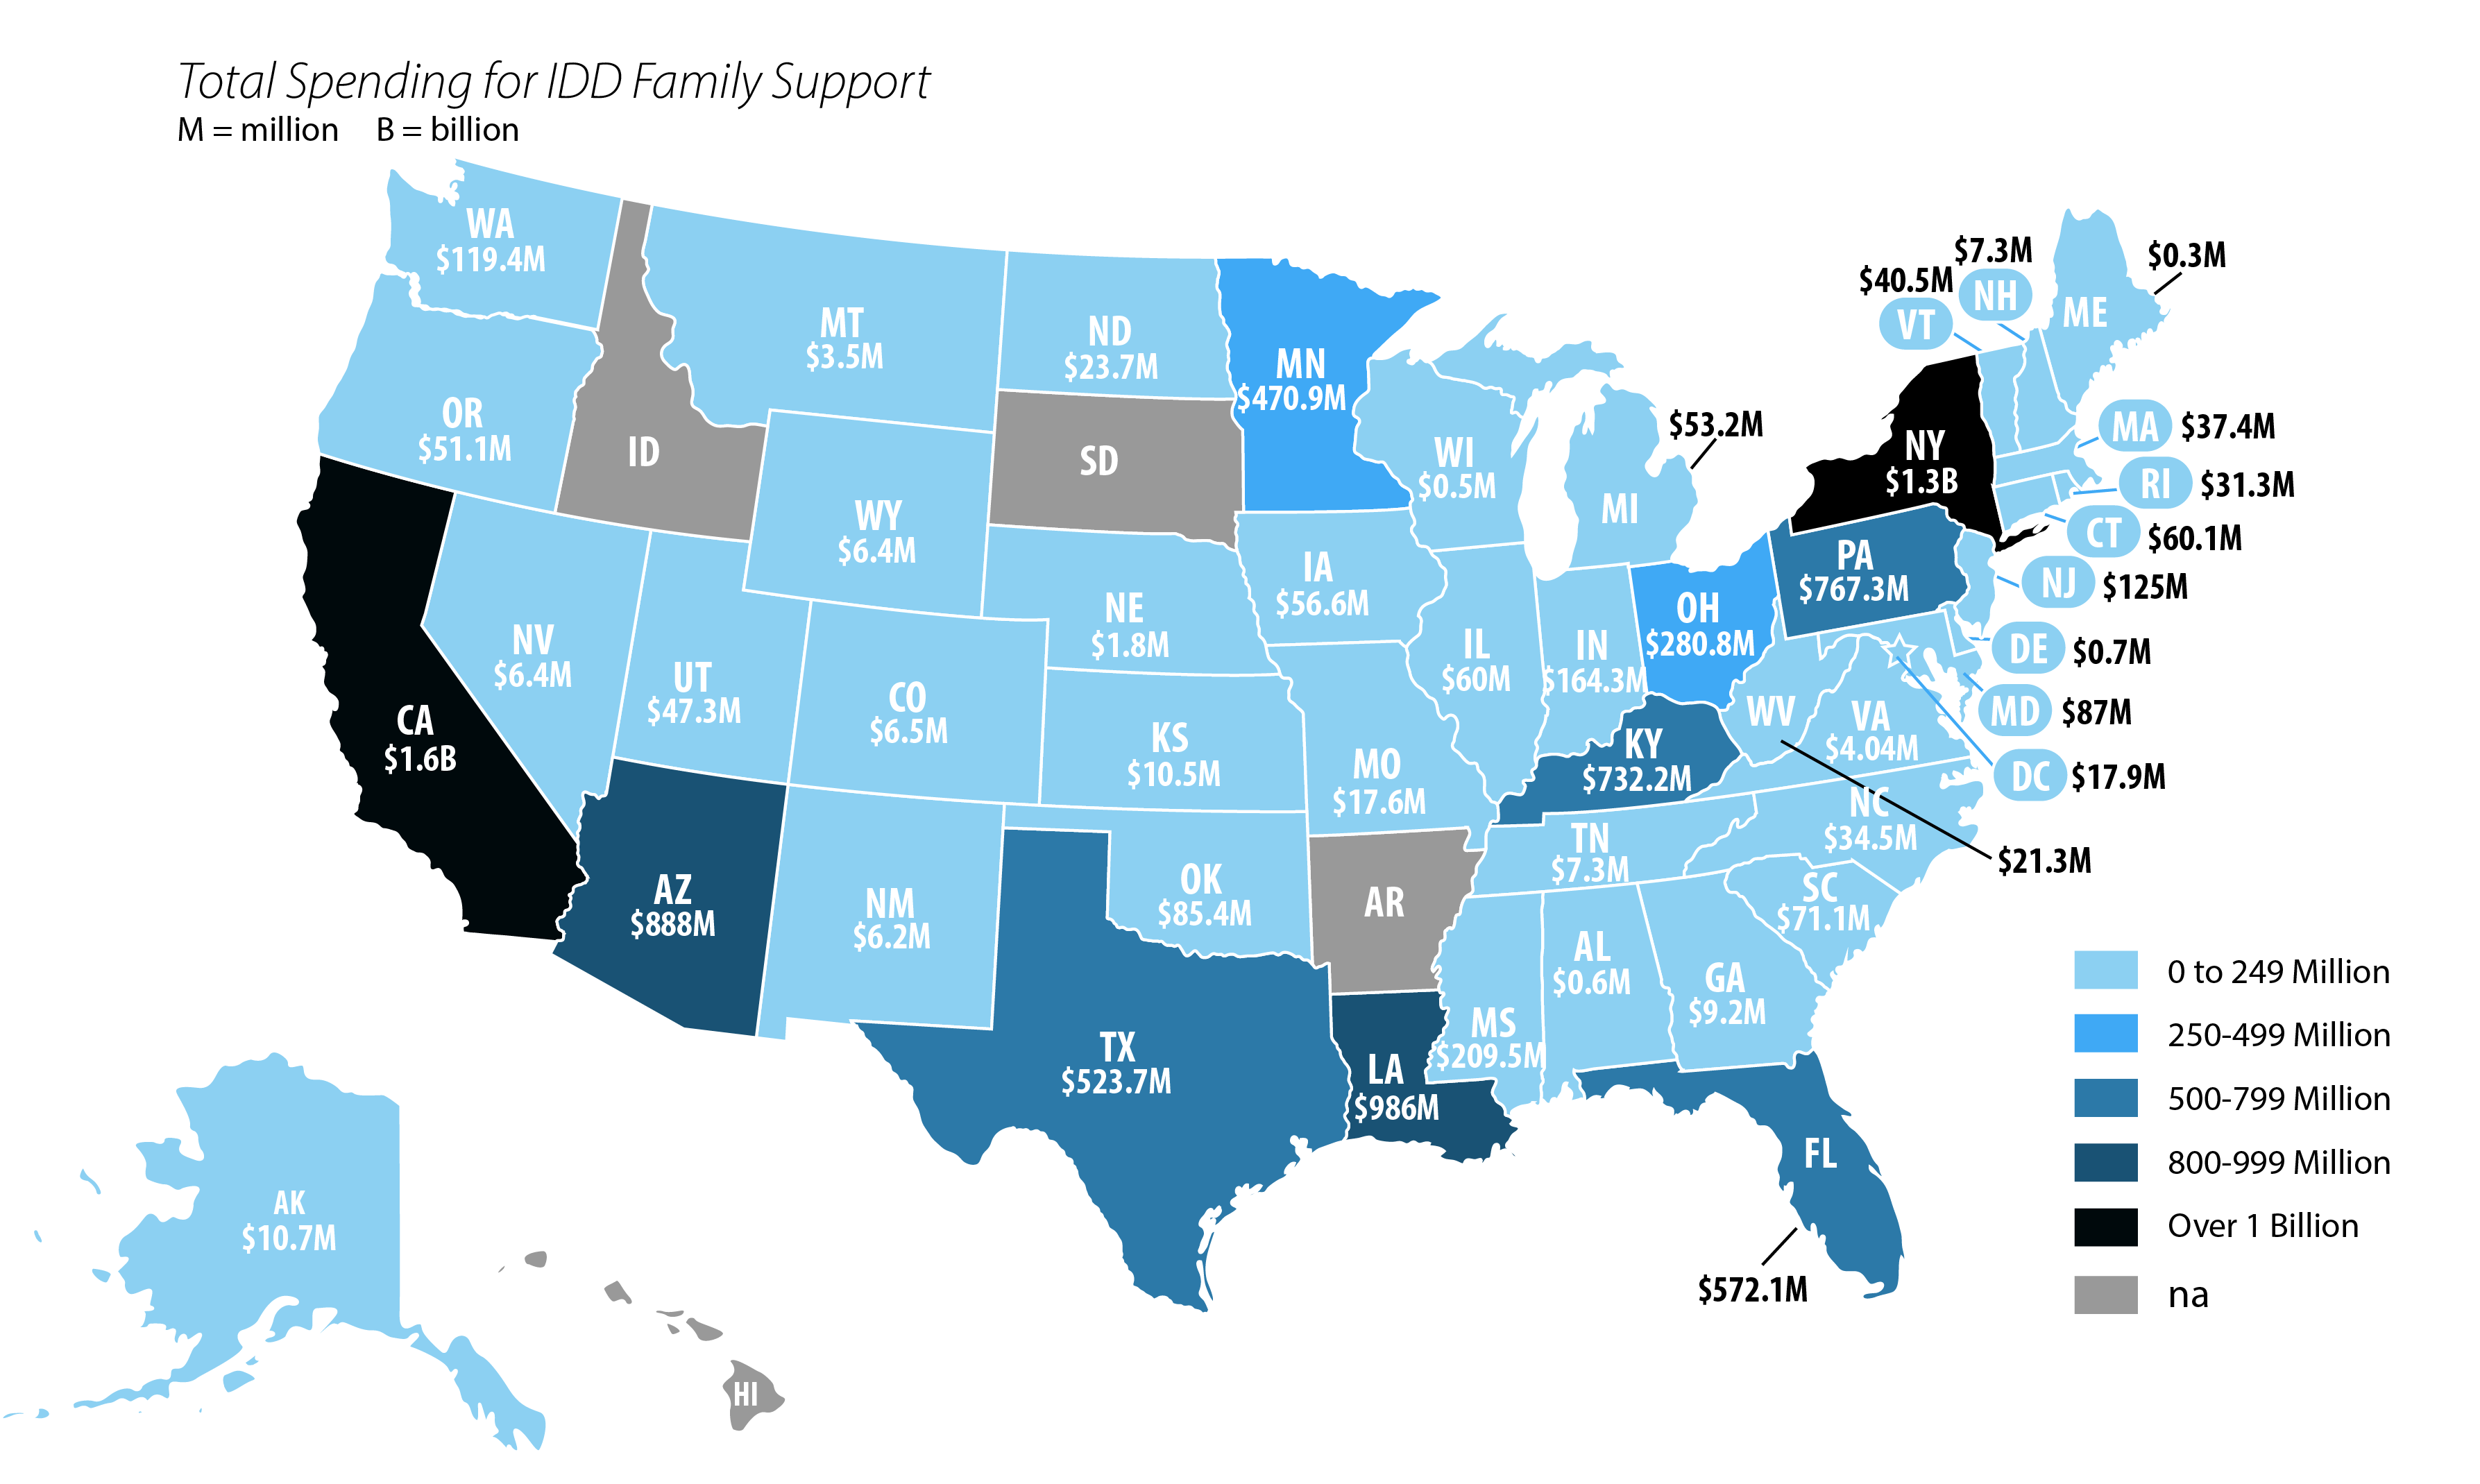 Family supports are community-based services provided to families of children or adults with an intellectual or developmental disability living in the family home, with the family as the primary beneficiary.
There are two categories of family support: financial subsidy/cash payments to families and general family support payments including respite care, family counseling, equipment, architectural adaptation of the home, parent education and training, or other state-designated categories of family support. A state agency may provide vouchers, direct cash payments to families, reimbursement or direct cash payments to serve providers.
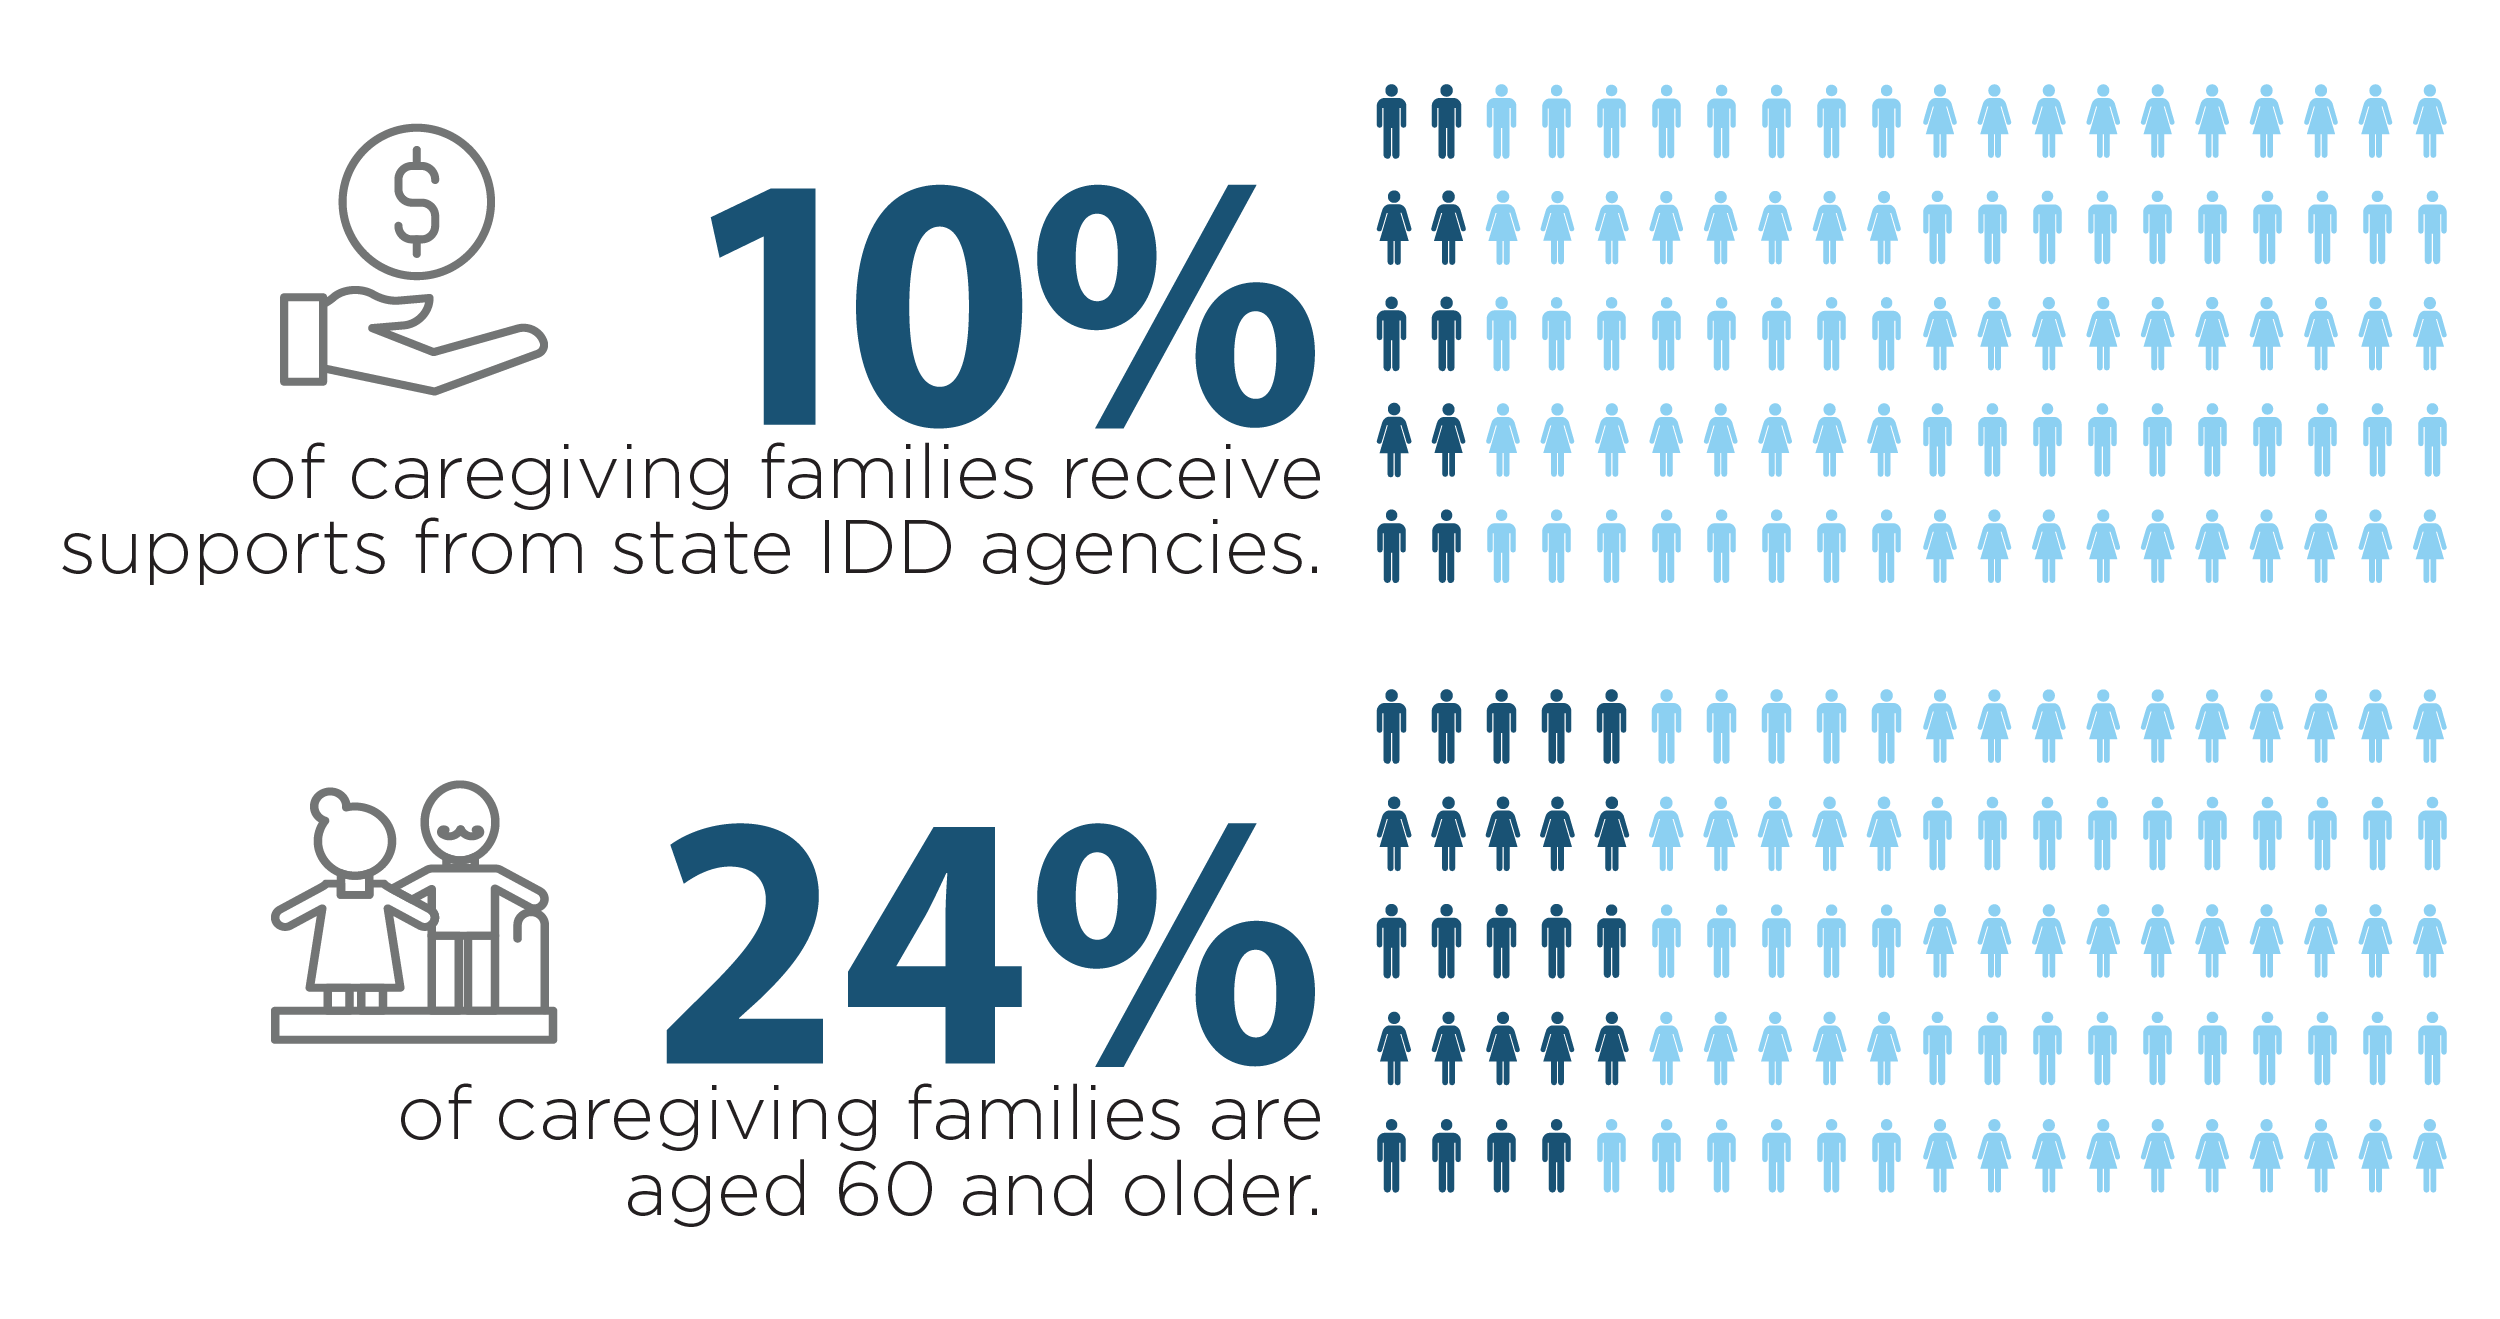
In 2021, while 72% of people with intellectual and developmental disabilities lived with family members, only 10% of all caregiving families receive supports from state intellectual and developmental disabilities state agencies.
Personal assistance: $4.66 billion
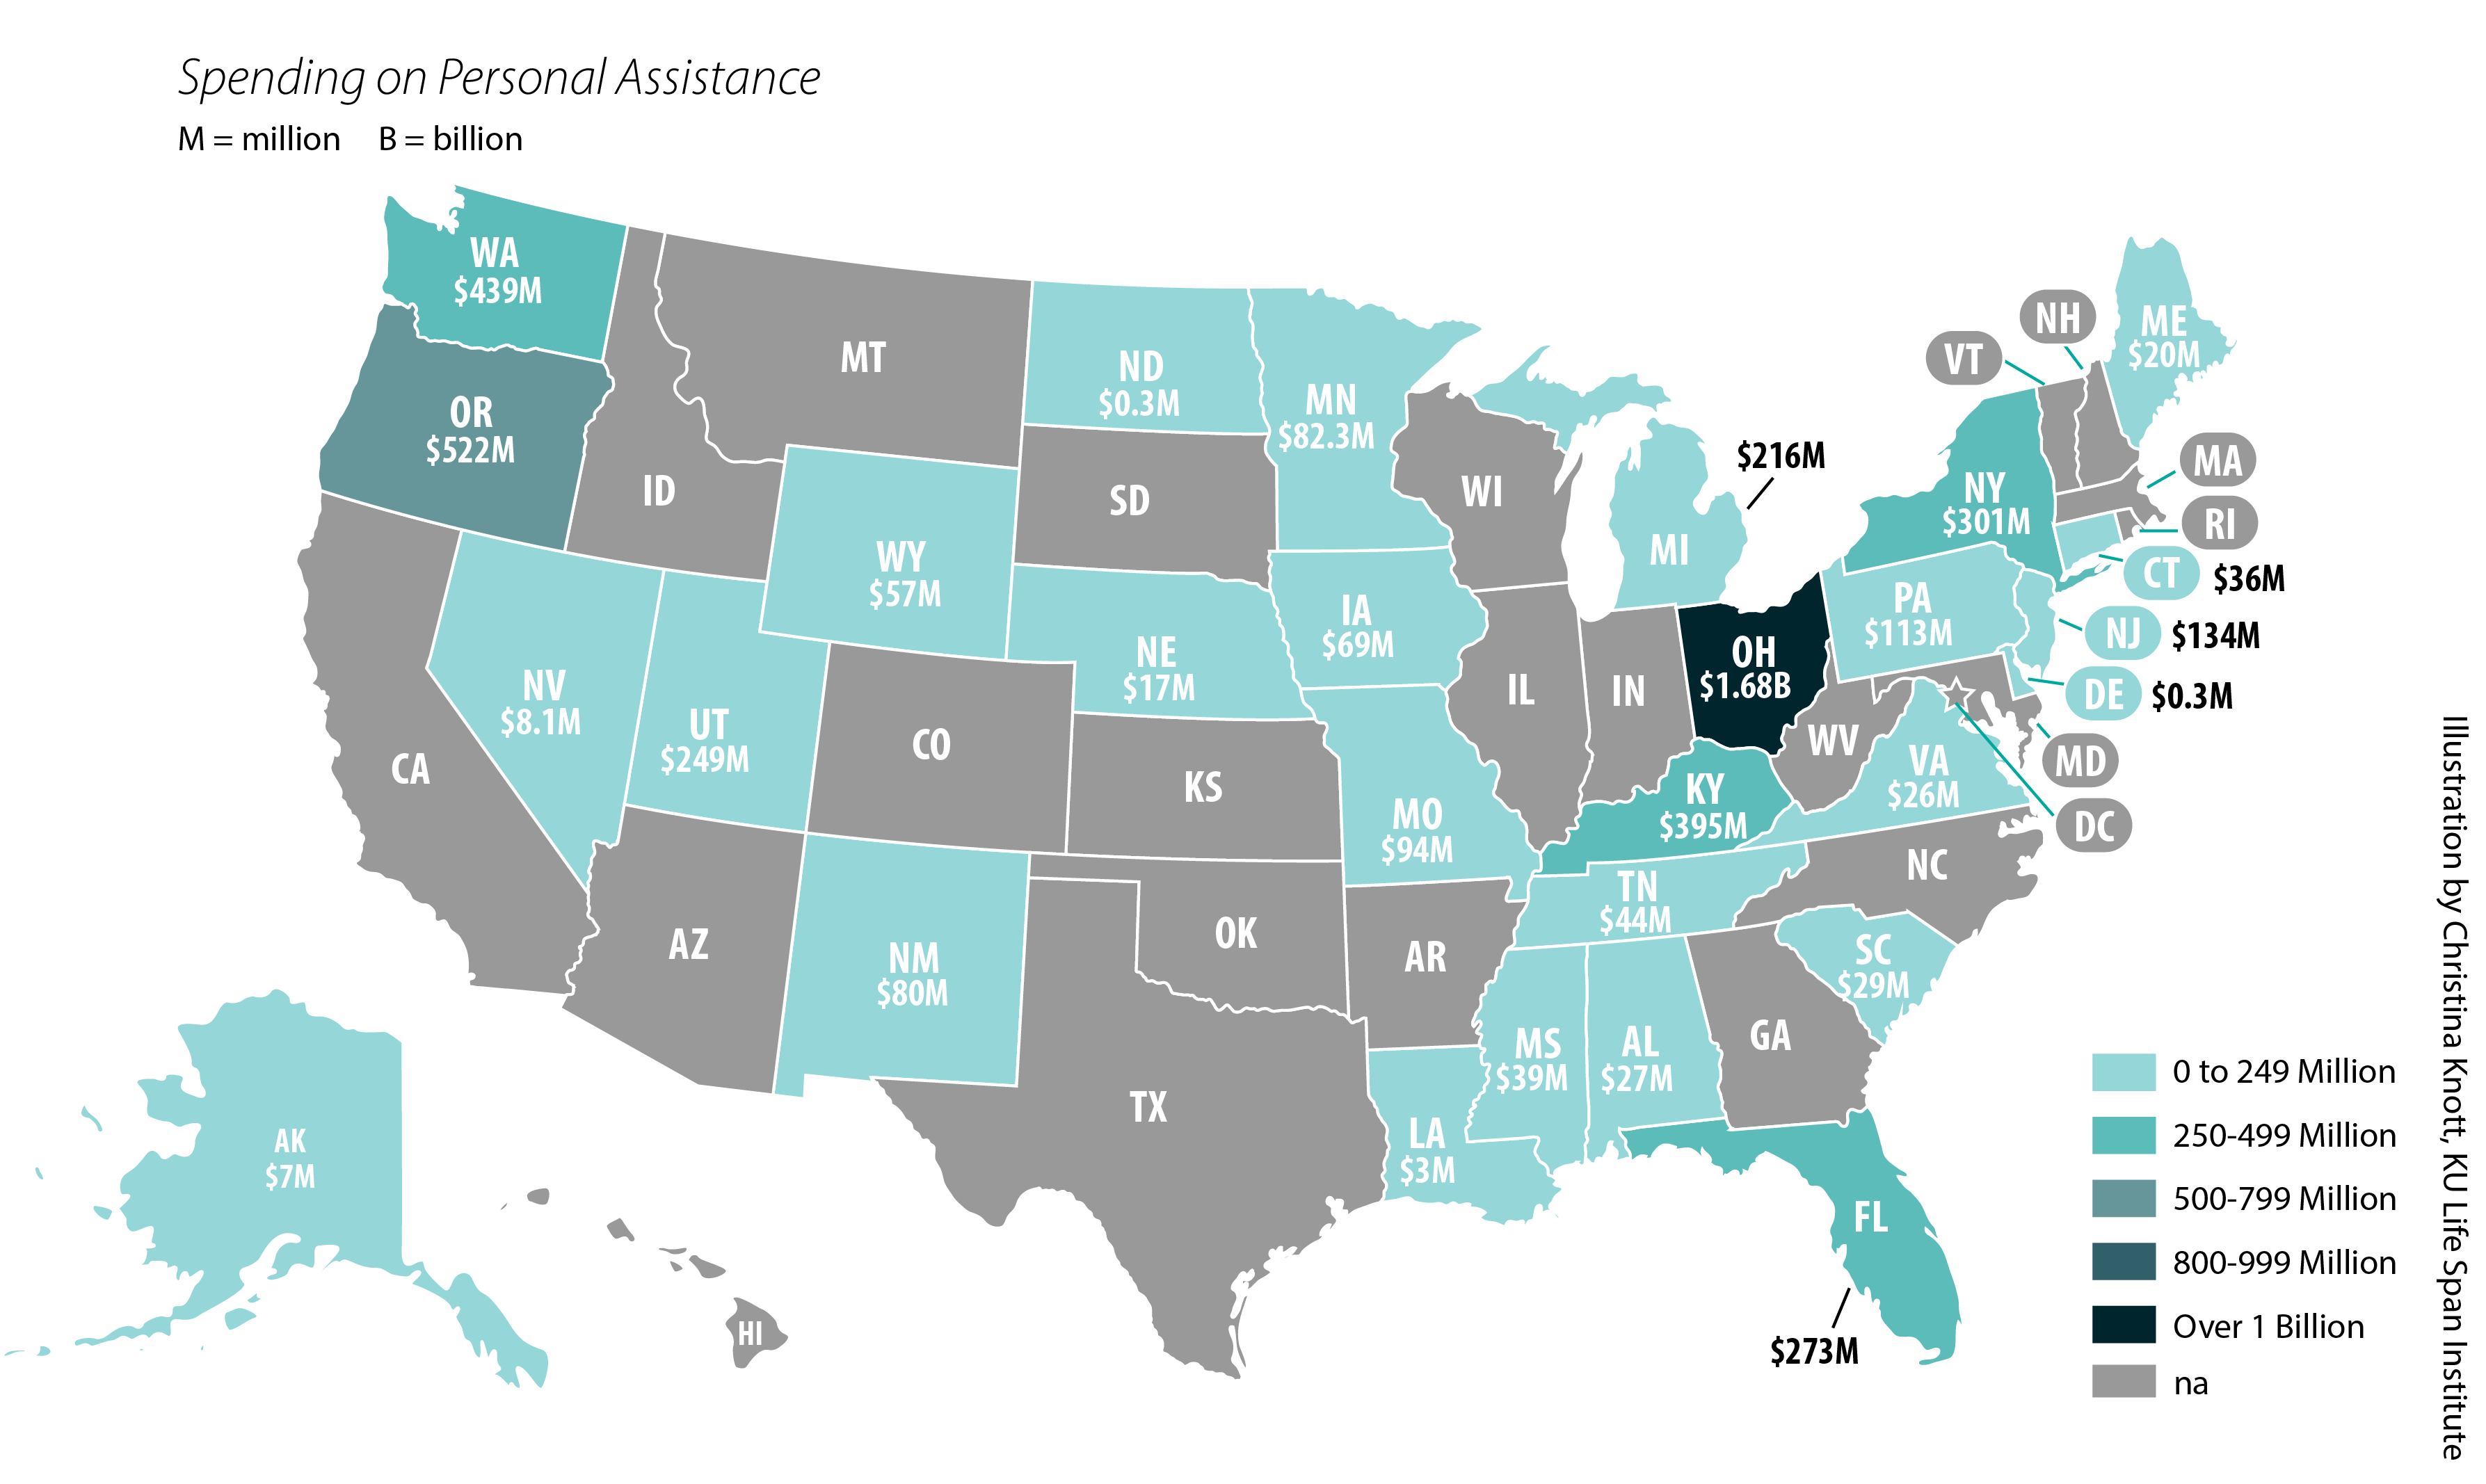
Personal assistance funds provide adults with intellectual and developmental disabilities the necessary level of support to remain in their homes. Some people use personal assistance to support daily activities such as getting up and ready for work, bathing, dressing, cooking, cleaning or running errands, while for others it can be support in the workplace. Personal assistance includes guidance toward more independence and arrangements that offer the participant self-direction.
Supported Employment: $860.80 Million
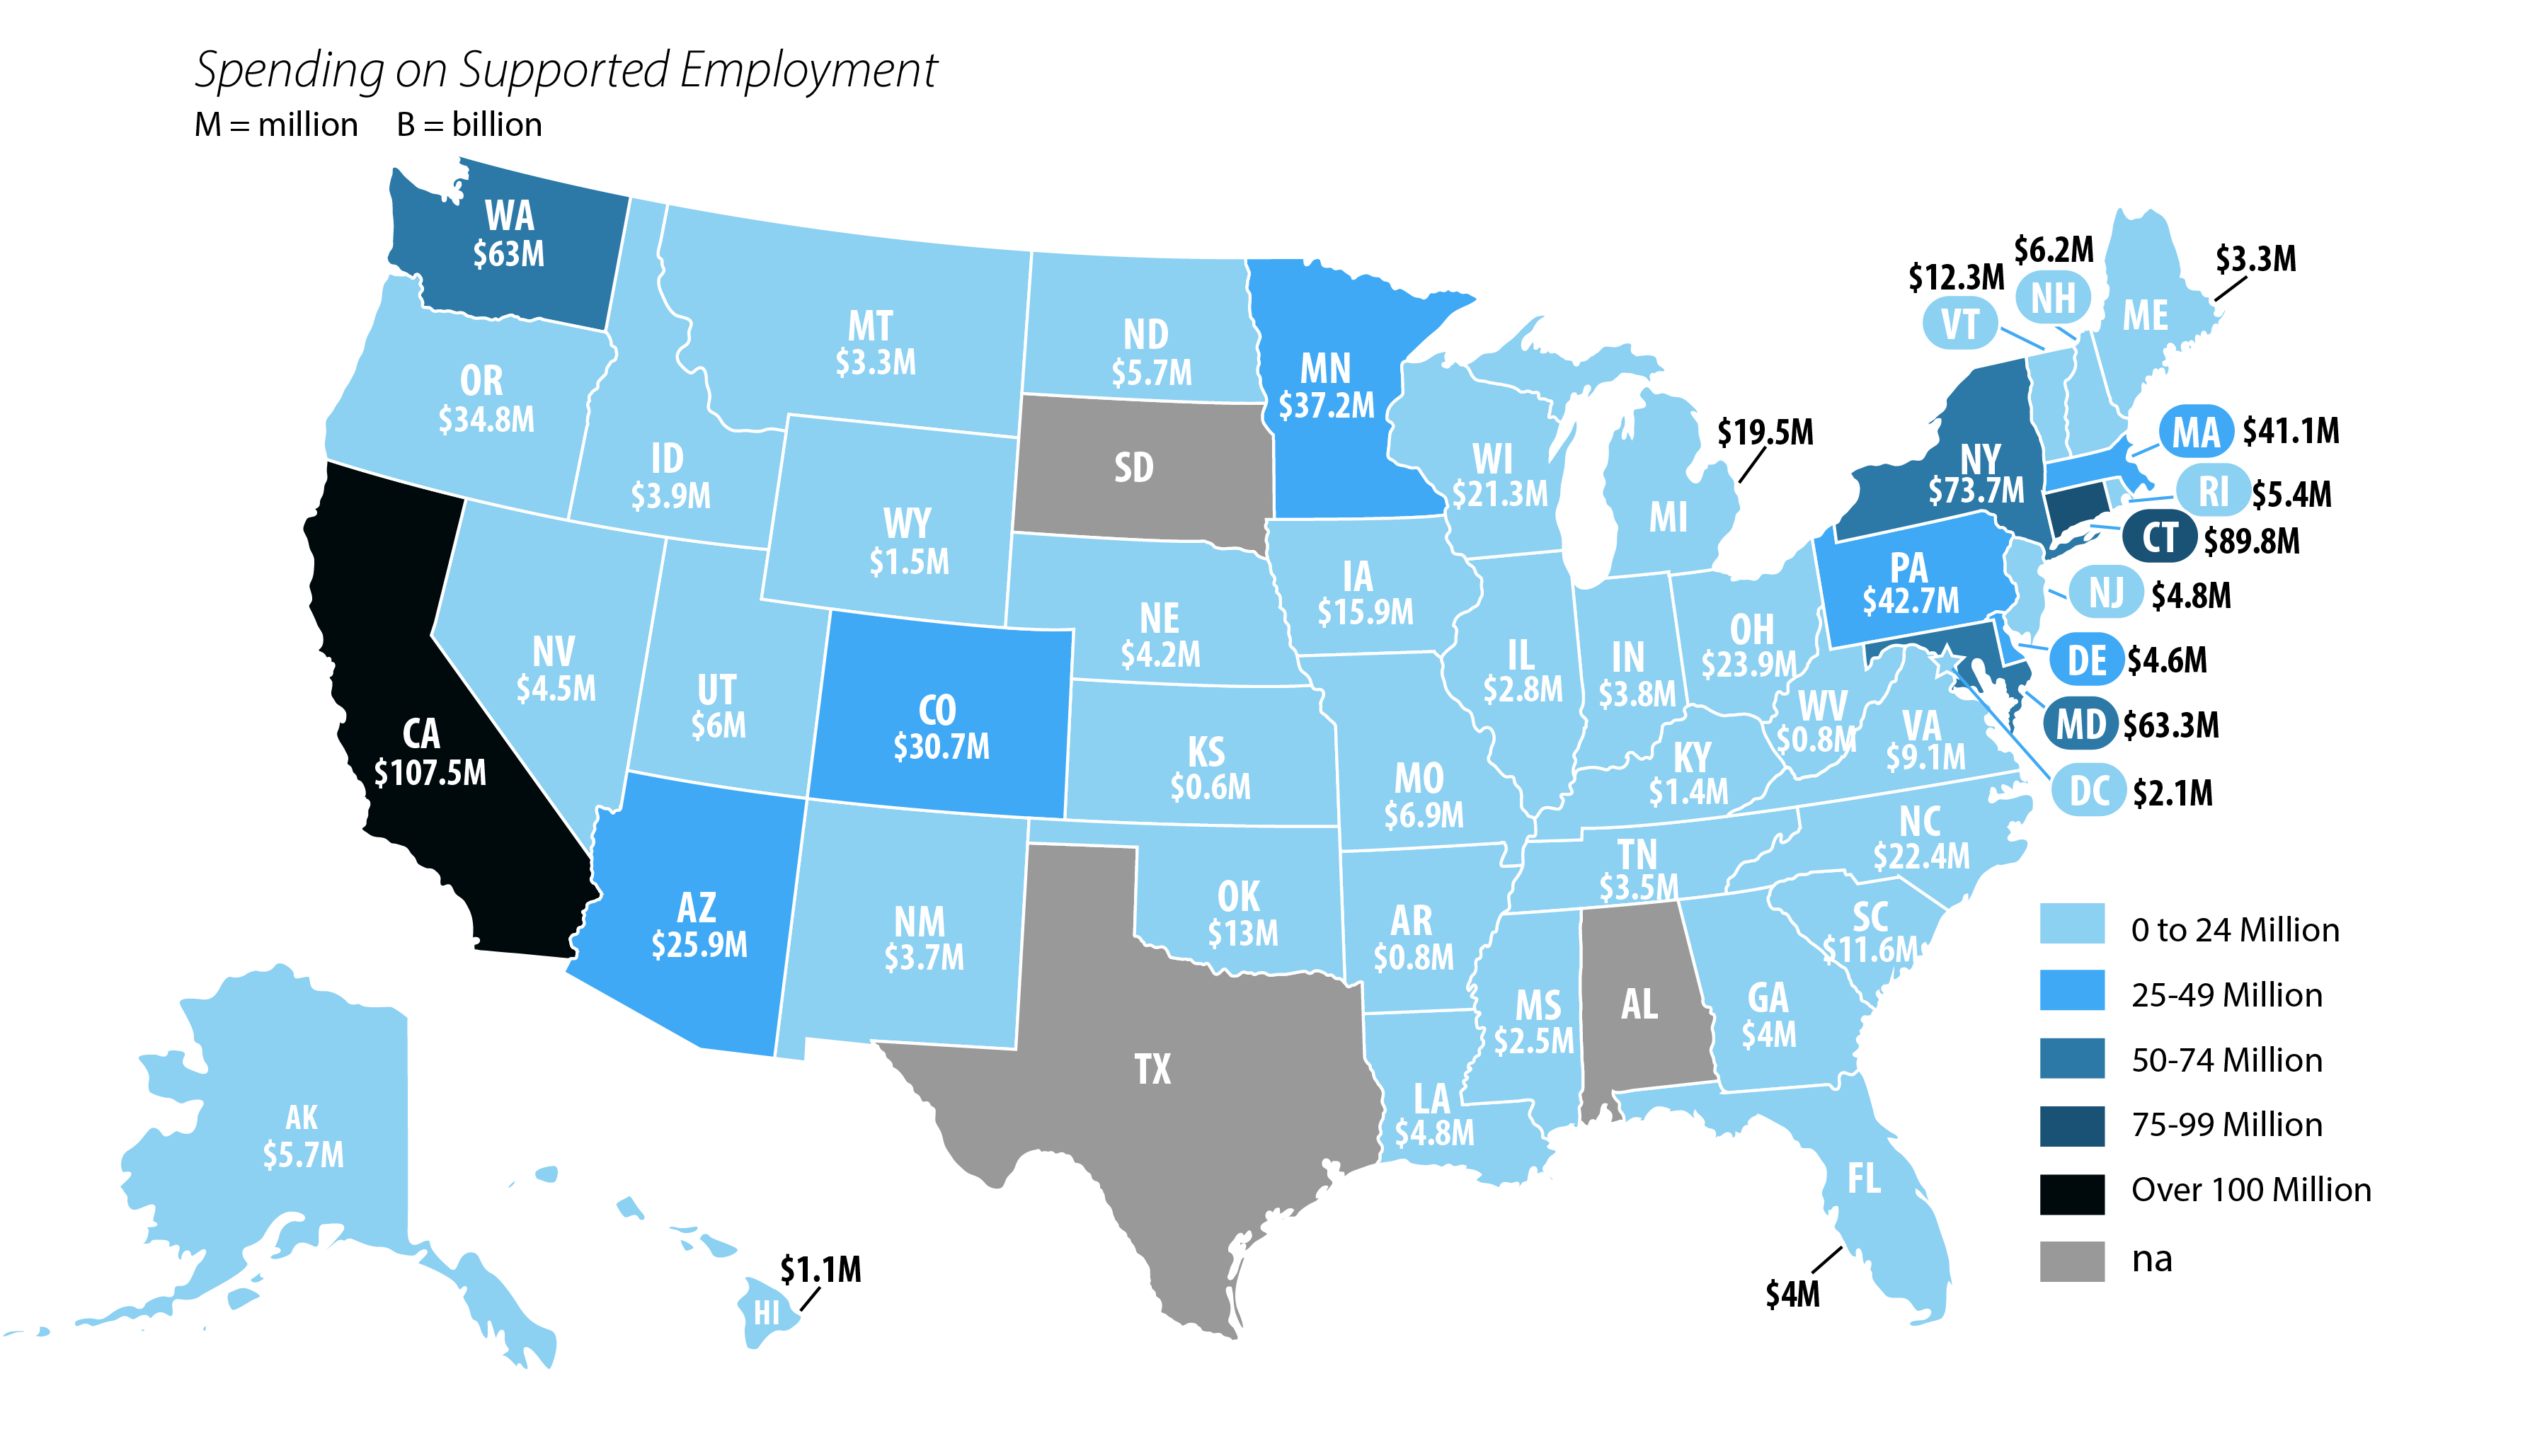
There were 536,771 work participants funded through federal or state employment support in FY2021. Of these, 22% were in supported employment programs or services. This is down nearly 14% from a total of 622,297 work participants in 2019.
Employment investments include support for obtaining and retaining what is known as competitive integrated employment, or CIE. In CIE, the individual is compensated at or above minimum wage comparable to pay to employees without disabilities performing similar duties, receives similar benefits, interacts with other individuals without disabilities and has similar opportunities for advancement.
Additional highlight: technology for IDD services and support
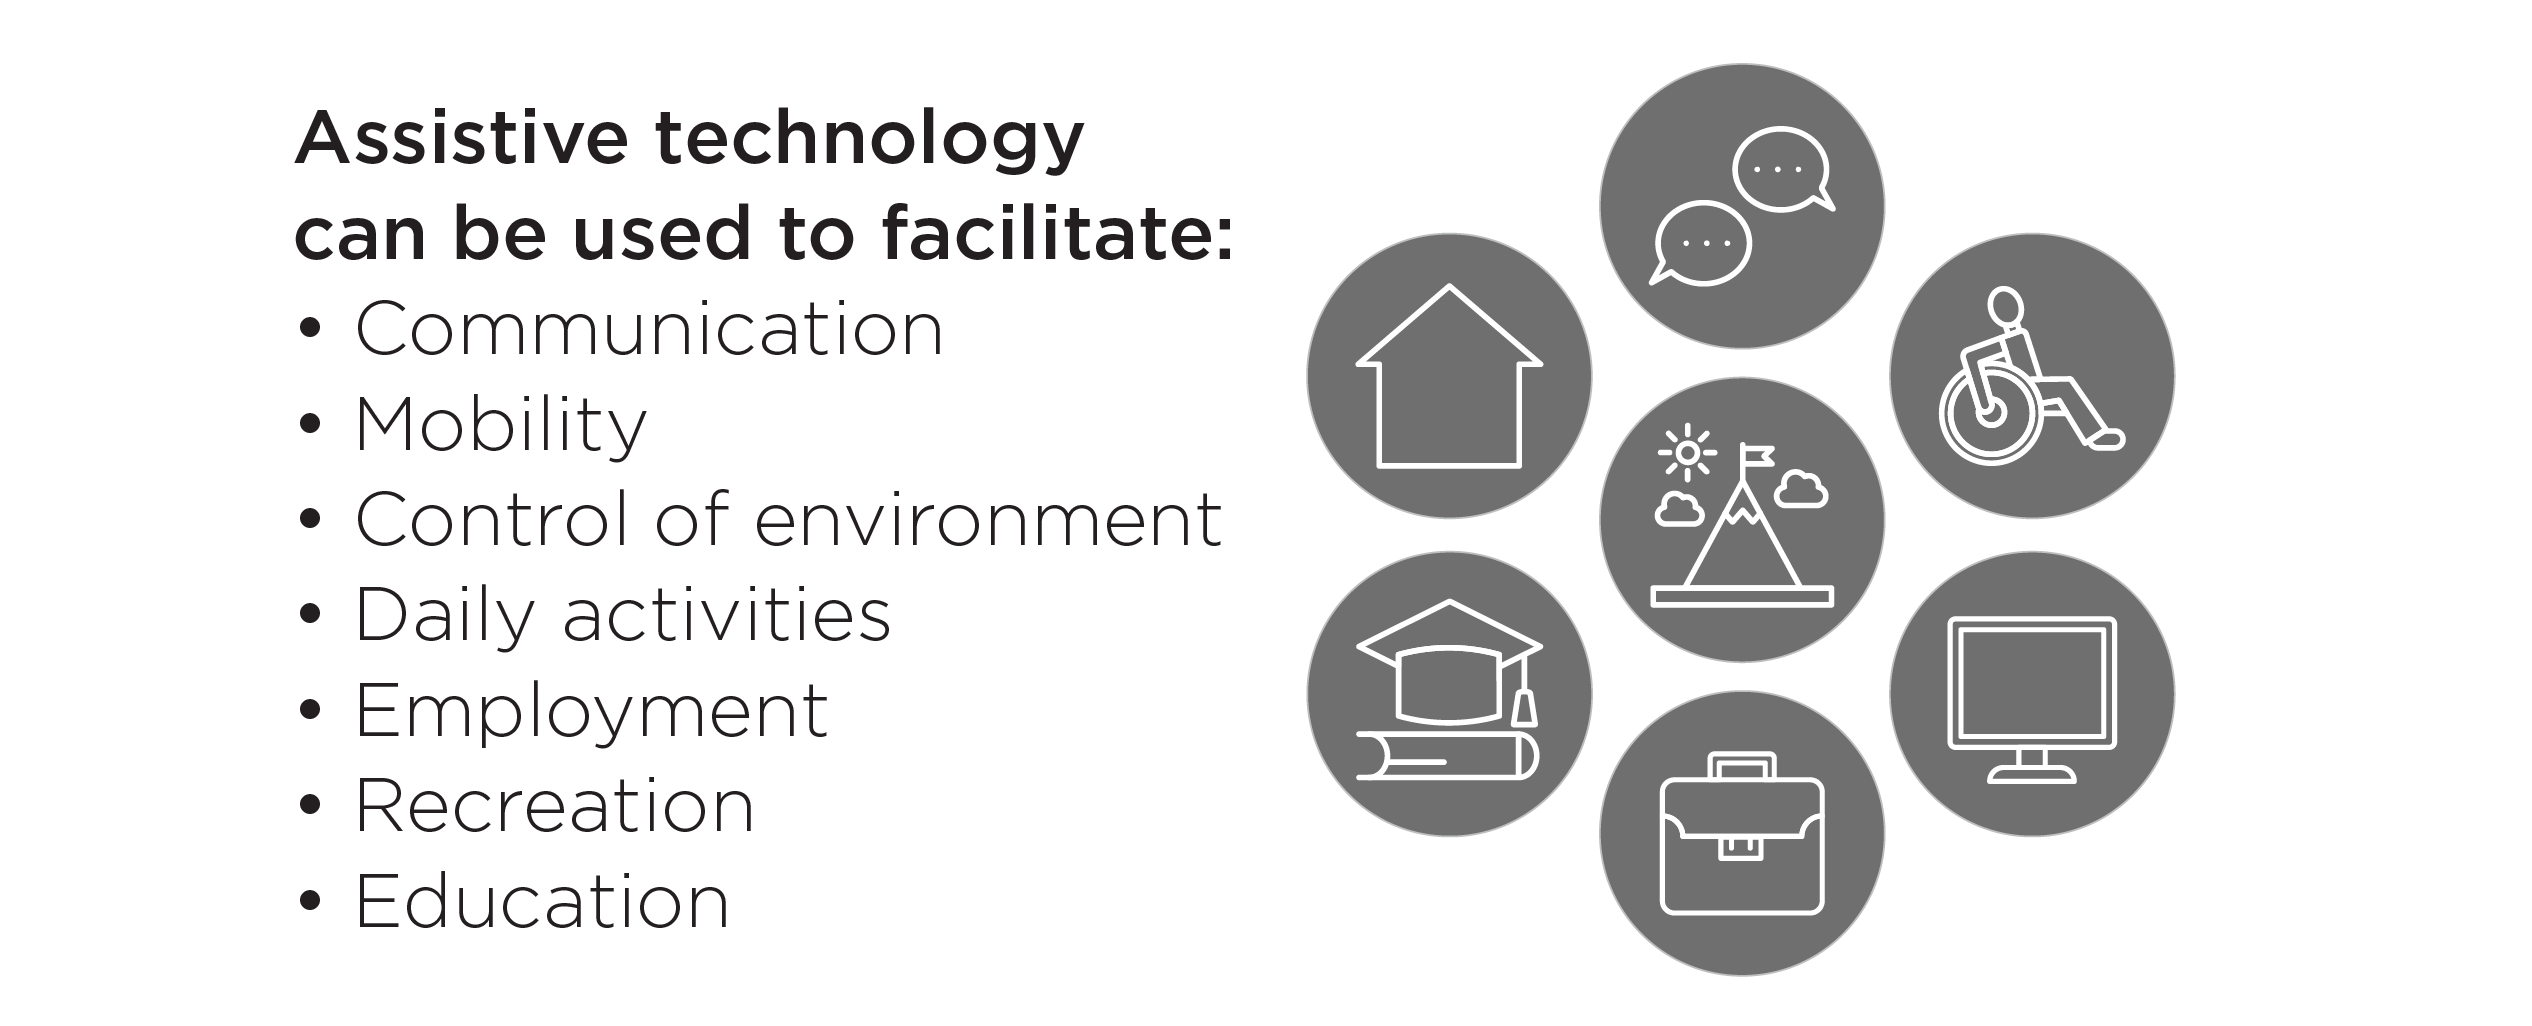
Technology solutions allow for the inclusion of multifunctional and diverse technologies. This can include smartphones — where a single feature may mediate an impairment, but also to achieve other goals such as personal communication, education and civic engagement.
Less than 1% of funding from IDD spending by states is used for technology solutions.
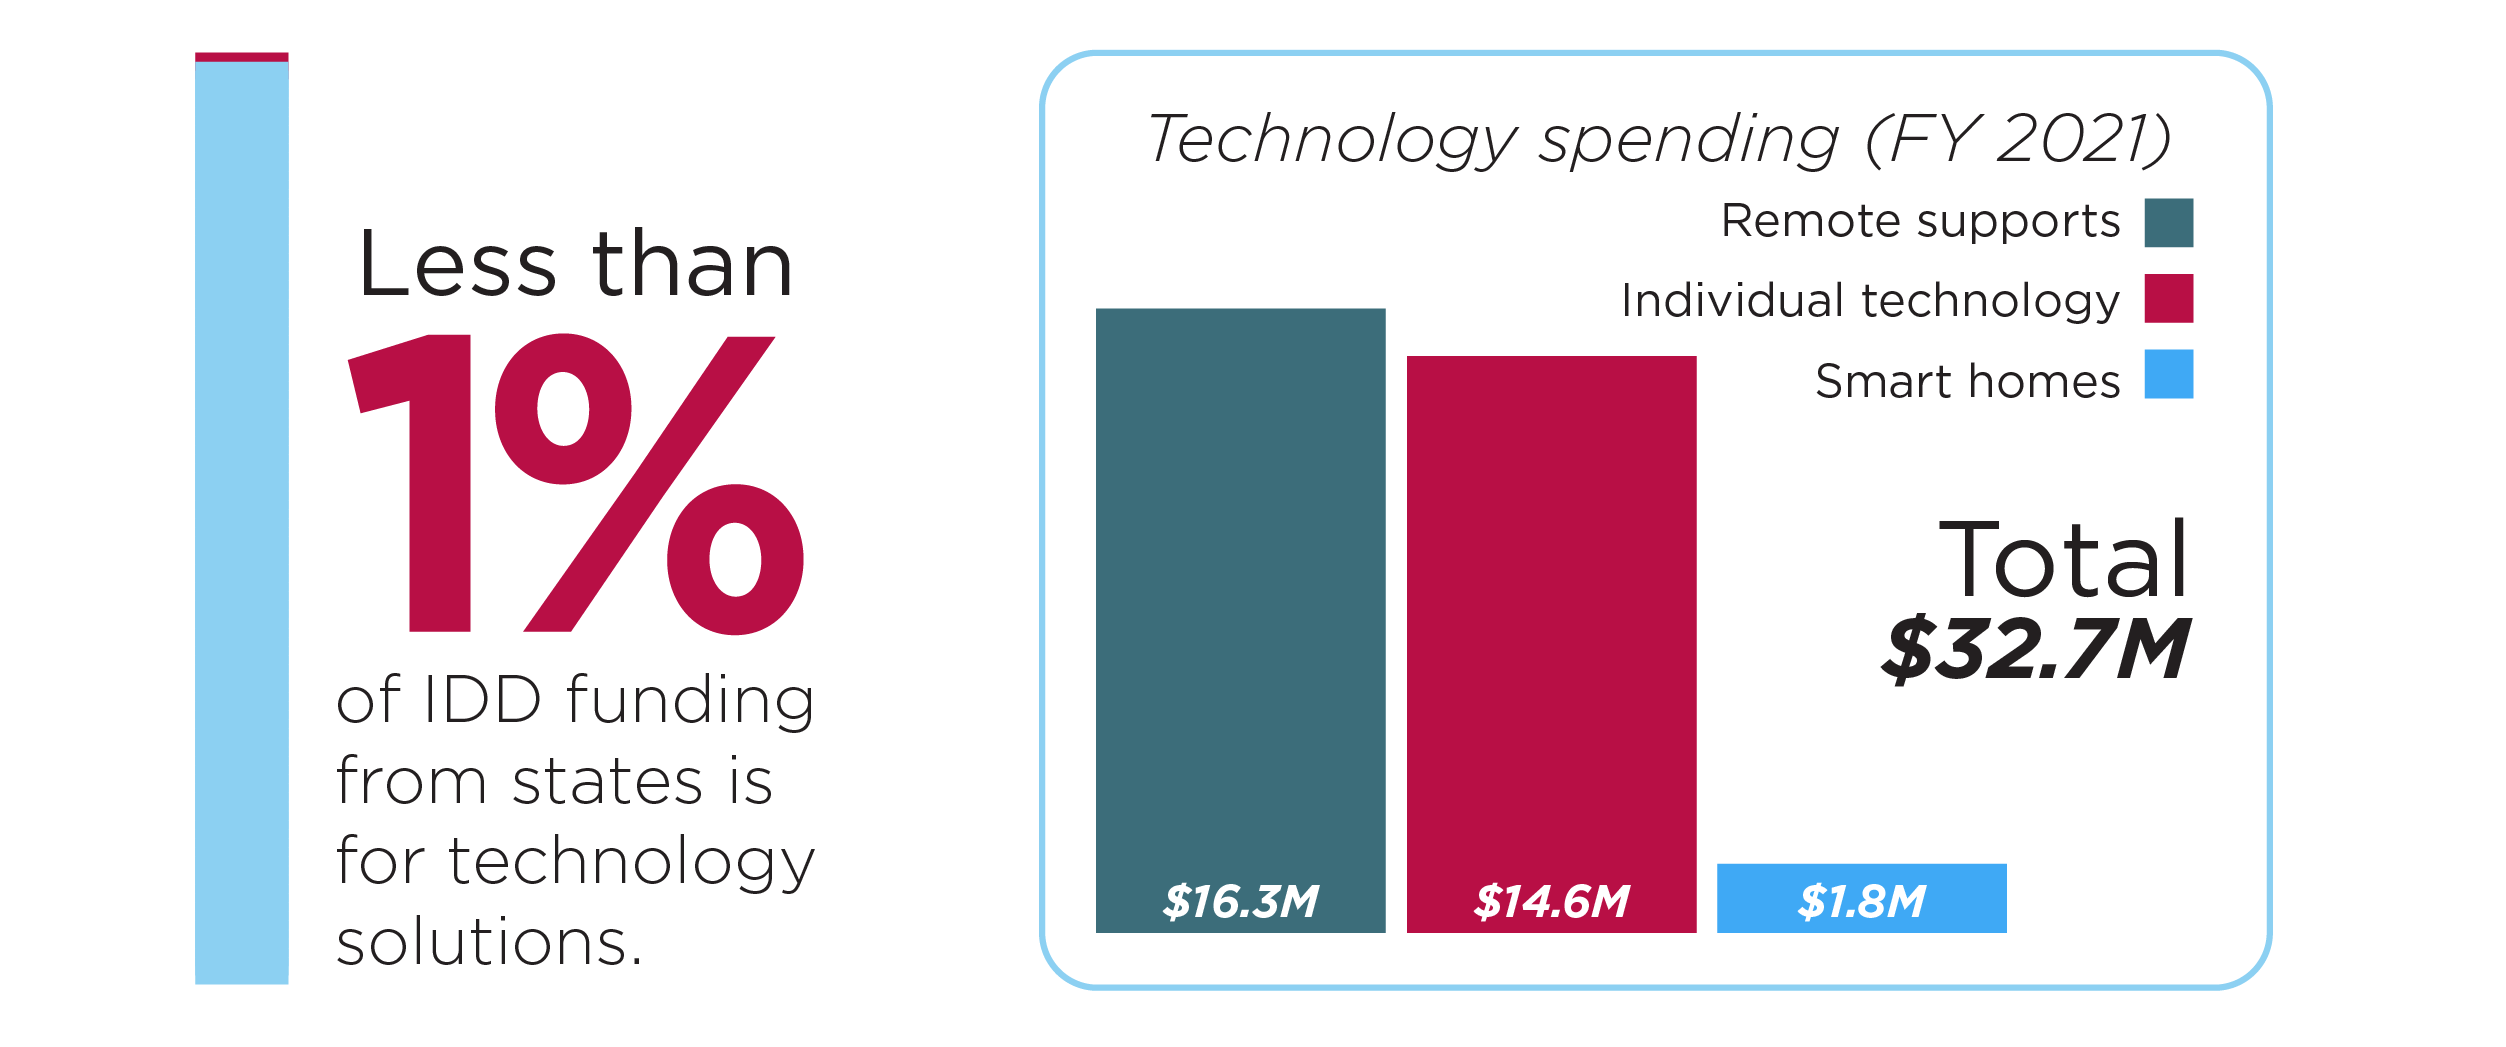
Image and text credits: Top, Adobe Stock and Christina Knott; Shea Tanis image, Drew Rosdahl; all other graphics and maps, Christina Knott. Text by Jen Humphrey.